By the Numbers: Small Project (<40km) Adjudication Timelines Since 2019
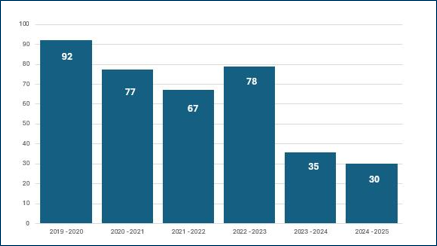
Average Number of Days to Completeness Determination
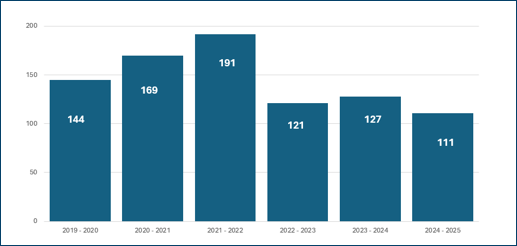
Average Number of Days from Application to Decision
- Date modified:
Average Number of Days to Completeness Determination
Average Number of Days from Application to Decision