Recent changes to longstanding geopolitical and trade relationships—including tariff volatility and trade regime uncertainty—have sharpened the focus of Canadians, policy makers, and businesses on the security, resiliency, and competitiveness of the Canadian energy system.
Energy security is a broad concept, generally it refers to having consistent and sufficient access to energy resources, fuels, and technologies that meet evolving needs at affordable prices. Connecting energy supplies and end-uses requires robust infrastructure that can withstand potential disruptions from physical, geopolitical, and digital threats. Accordingly, energy self-sufficiency can be one important element of energy security.Footnote 1
Security of the energy system is important because Canadians rely on energy for nearly all aspects of daily life. In the case of home heating or electricity, extended disruptions can have serious consequences for the health and wellbeing of individuals. Having secure access to energy also supports the competitiveness of the Canadian economy—businesses and industries depend on reliable access to affordable energy.
Diversifying the markets for Canada’s energy exports has also become a growing focus of the Canadian energy dialogue. Energy trade in Canada is strongly integrated with the U.S. and increasing Canada’s access to diverse markets has the potential to enhance Canada’s economic resiliency and competitiveness.
In Canada, drivers of energy security and trade diversification can depend on the region or type of energy. Through the lens of this report’s projections, we look at three aspects of the Canadian energy system, recognizing that these aspects are not exhaustive and that other energy security considerations fall outside the scope of this analysis:
Compared to many countries where a significant portion of energy is imported, Canada, overall, is relatively energy self-sufficient. At the same time, the types of energy used in different regions across Canada do not always align with locally available resources.
A key example is the Ontario and Quebec market for natural gas and RPPs (e.g., gasoline and diesel). While central Canada is a large consumer of both, the region produces little to no natural gas or crude oil—crude oil being the primary input for producing RPPs at refineries. Significant energy transportation infrastructure exists to supply the region with these fuels from other provinces and from abroad, primarily the U.S.
Recent trade and geopolitical developments have heightened interest the steps Canadian policy makers and businesses could take to enhance energy self-sufficiency. In central Canada, this could include increasing the share of domestically produced crude oil and natural gas that is supplied to the region, as well as reducing reliance on pipelines that currently transit through the U.S. It could also include shifting the region’s fuel mix to energy sources that can be produced within the region, such as electricity.
In the Current Measures, Higher, and Lower scenarios, use of RPPs (and hence crude oil) and natural gas in central Canada is stable over the projection period. The major pipeline systems delivering crude oil and natural gas to the region are likely currently operating near their capability to deliver volumes into central Canada, implying that the region’s energy security would not significantly change absent major energy transportation infrastructure changes.
In Canada Net-zero, lower RPP and natural gas use over the projection period could enhance energy self-sufficiency by increasing the share of energy that could be produced locally, such as electricity and hydrogen.
Combined, Ontario and Quebec consumed just over 900 Mb/d of RPPs in 2024, nearly half of all the RPPs used in Canada that year. RPPs are primarily used in the transportation sector to move people and goods, with the petrochemical sector also making up a sizable portion of demand in Ontario.
Most RPPs in the region are produced at 6 domestic refineries (4 in Ontario and 2 in Quebec), which together can process almost 800 Mb/d of crude oil. In 2024, Central Canada imported 127 Mb/d of RPPs and exported 124 Mb/d. RPPs are both imported and exported due to factors such as refinery configurations, local logistics, and seasonal supply and demand fluctuations.
RPPs are transported within the region by rail, marine, and truck shipments, as well as by the Trans-Northern Pipeline, which distributes RPPs from refineries in Montreal and southern Ontario to delivery points in both provinces.
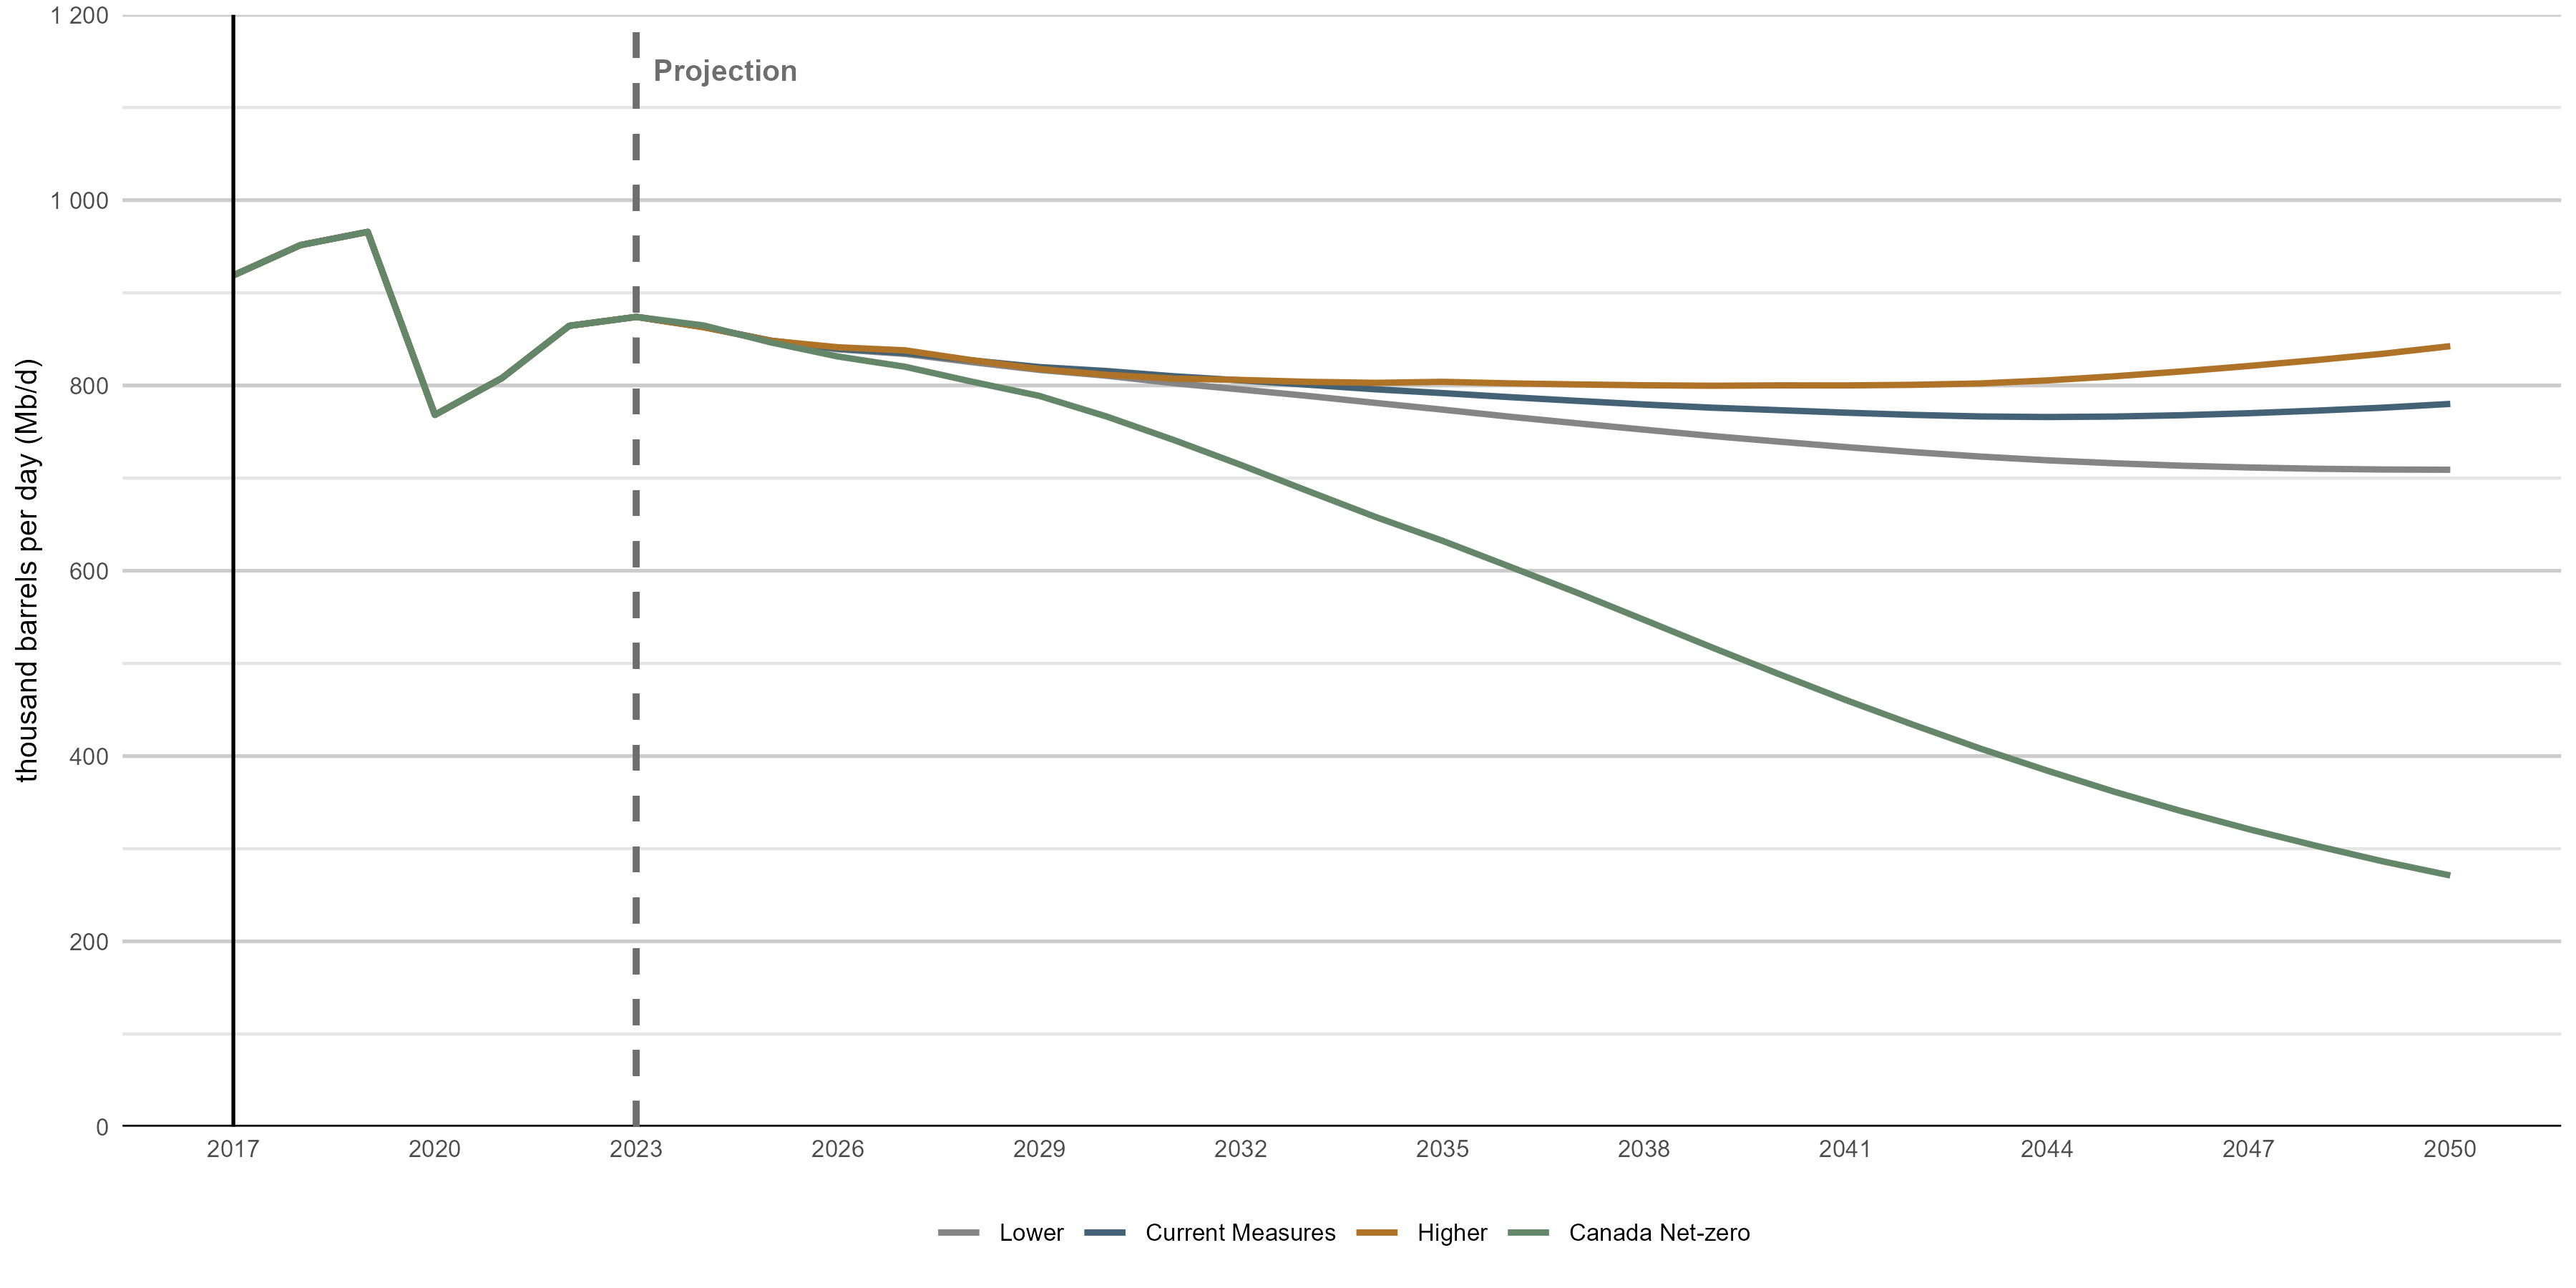
The projections for RPP use in Ontario and Quebec largely match the broader RPP trends for Canada. As shown in Figure S.1, in the Current Measures, Higher, and Lower scenarios, total RPP use in Ontario and Quebec is relatively flat over the projection period, staying below pre-2020 levels through 2050.
Text Alternative: This line chart shows combined RPP demand in Ontario and Quebec from 2017 to 2050 for each scenario, in thousand barrels per day (Mb/d). In the Current Measures, Higher, and Lower scenarios, demand remains relatively stable, or declines slightly, over the projection period. In the Canada Net-zero scenario, demand declines steadily throughout the period, falling substantially by 2050.
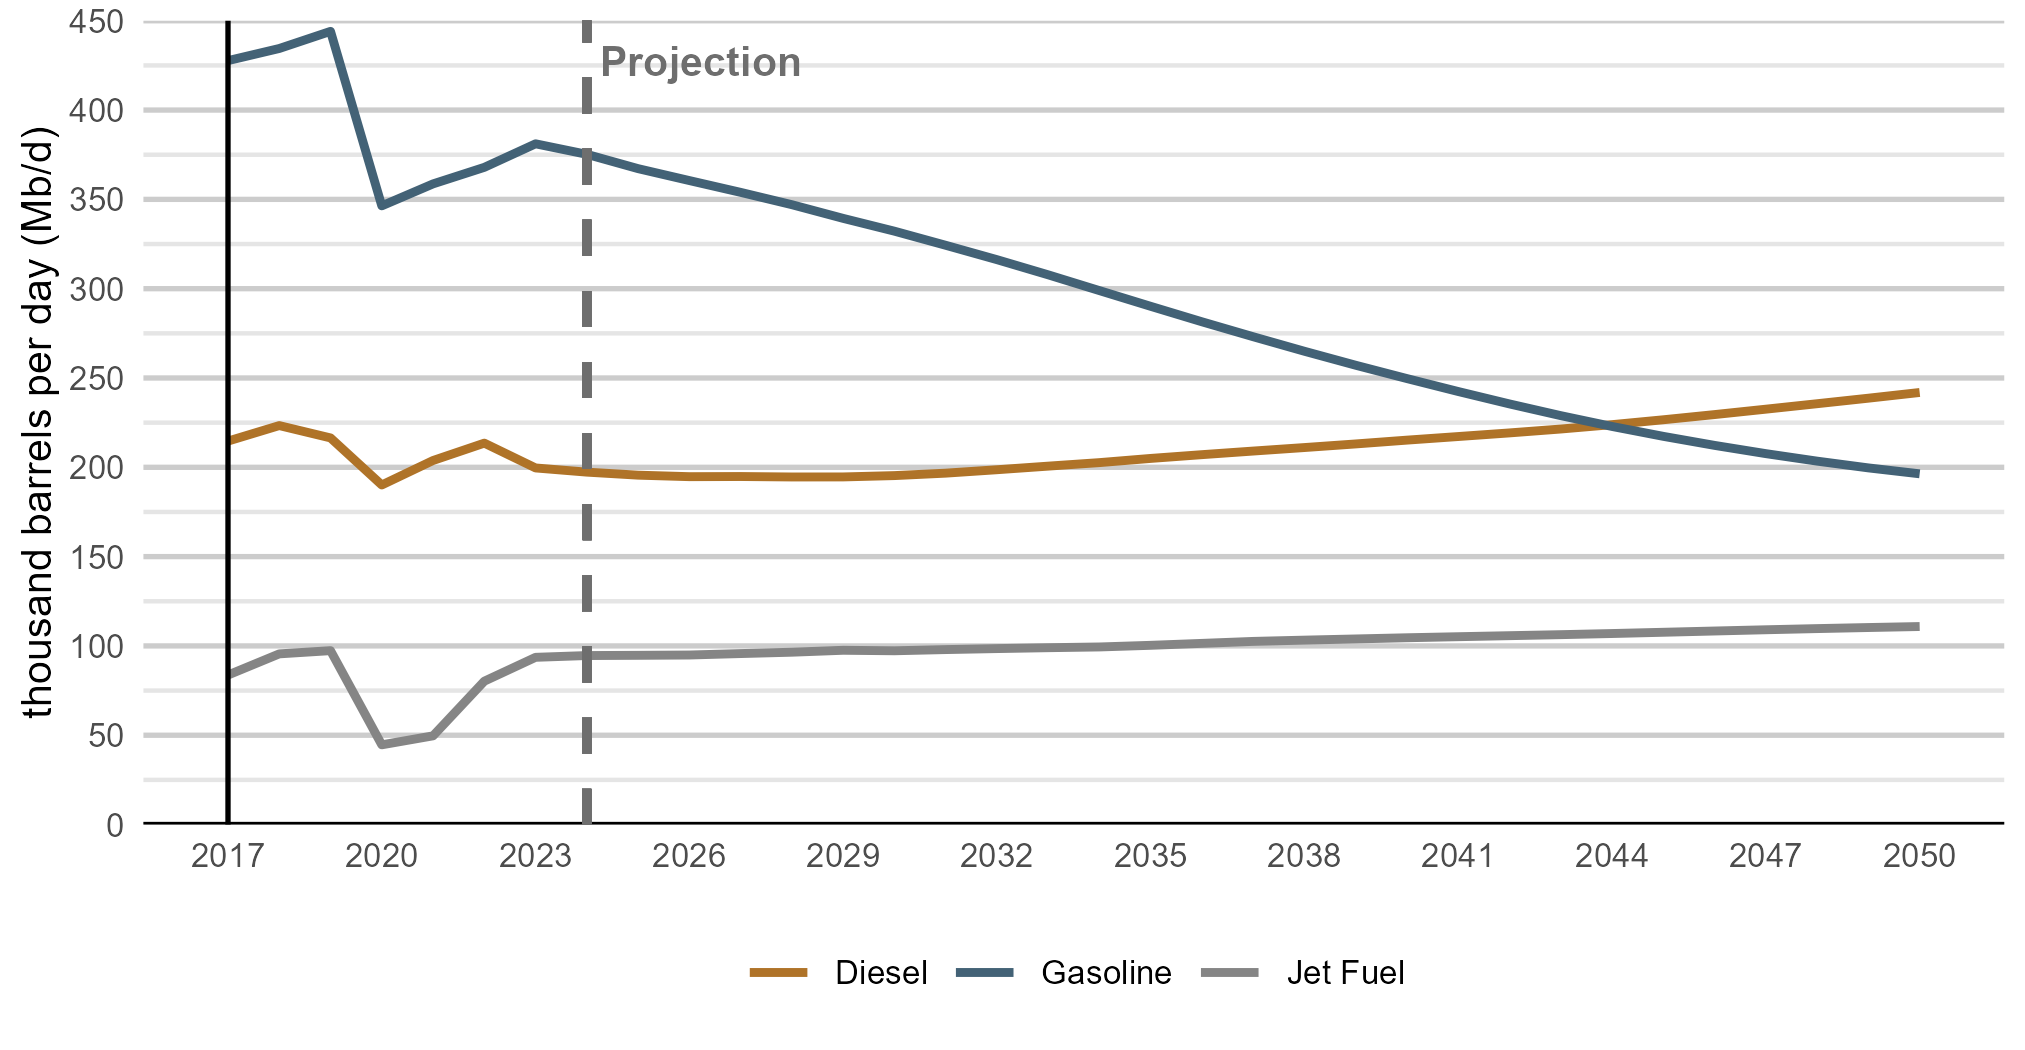
While total RPP demand is relatively stable in these three scenarios, the share of different types of fuels changes significantly. The share of passenger EVs grows brisklyFootnote 2, putting considerable downward pressure on gasoline use as it is replaced by electricity as the main fuel for passenger transportation. As shown in Figure S.2, partially offsetting declining gasoline use is growing demand for diesel (for freight transportation), which occurs in the Current Measures, Higher, and Lower scenarios.
Text Alternative: This line chart shows combined gasoline, diesel, and jet fuel demand in Ontario and Quebec from 2017 to 2050 in the Current Measures scenario. Gasoline demand declines steadily over the projection period. Diesel demand remains relatively stable early in the projection, then gradually increases toward mid-century. Jet fuel demand drops sharply around 2020 (COVID-19 pandemic), then recovers and increases slowly through the remainder of the projection period.
This shift in fuel use has the potential to somewhat enhance central Canada’s energy self-sufficiency. The region has been a net importer of gasoline and a net exporter of diesel for many years. In 2024, the region imported 62 Mb/d of gasoline and only 2 Mb/d of diesel, while exporting 50 Mb/d of diesel and 22 Mb/d of gasoline. Lower gasoline demand could mean fewer RPP imports while growing use of diesel could be met through reduced exports of that fuel.
Jet fuel use increases by 18% from 2023 to 2050 in Current Measures and increases steadily in the Higher and Lower scenarios, reflecting continued increases in passenger air transportation. In 2024 nearly a third of jet fuel used in the region was imported. Significantly increasing domestic jet fuel production would likely require significant changes to existing refining infrastructure in the region.
Total RPP use in central Canada in Canada Net-zero drops significantly compared to the other scenarios, as shown in Figure S.1. Beyond the high adoption of passenger EVs in the other scenarios, Canada Net-zero sees greater growth in electrification of light freight vehicles and use of hydrogen in heavy-duty freight vehicles, as well as increasing use of sustainable aviation fuel instead of jet fuel. This drop in demand means there is potential to reduce the amount of RPPs imported into the region. It also reduces crude oil requirements in the region, including imports of crude oil from the U.S. In Canada Net-zero, more electricity and hydrogen are produced locally, which could enhance the region’s energy self-sufficiency. Increasing production of electricity and using more electricity to produce hydrogen may, however, face other challenges, as described in the following section in this chapter: Supply Chain Resiliency—Expanding Canada’s Electricity System.
Crude oil is the main input to produce RPPs at refineries. The volumes of RPPs and crude oil discussed in this section can be compared in broad terms, but are not strictly comparable, given factors such as the volumetric changes during the refining process.
Western Canadian crude oil is a key feedstock for Ontario and Quebec refineries. This supply reaches the region via the Enbridge Mainline pipeline system which traverses the prairies and U.S. Midwest before reaching southwest Ontario at Sarnia. In 2024, total flows on the pipeline system into Sarnia averaged 733 Mb/d. Most of these flows are crude oil produced in western Canada, but they also include some U.S. crude oil production—104 Mb/d in 2024. Another option for central Canada to access crude oil is via marine vessel shipments at Quebec City and other ports along the St Lawrence Seaway. Total imports of foreign crude oil to the region (via both the Enbridge Mainline and marine vessel) have been stable over the past several years at around 200 Mb/d. Since 2019, virtually all these imports of foreign crude oil into central Canada have come from the U.S.
Total future Canadian crude oil production is relatively robust in all scenarios, as described in the Results chapter. In all scenarios, crude oil production remains well above crude oil feedstock requirements at Canadian refineries implied by the RPP demand projections.
Crude oil type is also important as refineries in Ontario and Quebec are mostly optimized to use light crude oil (which can include bitumen that is upgraded into synthetic crude oil). Some refineries in the region can use some heavier crude oil feedstocks, with 159 Mb/d of heavy crude oil flowing into central Canada on the Enbridge Mainline system in 2024. In all scenarios, heavy crude oil makes up a growing share of production. However, light crude oil remains a significant portion of total western Canadian production, suggesting that the type of crude oil produced in Canada is unlikely to be a constraint in increasing self-sufficiency.
This section focuses on the energy self-sufficiency trends for the region in the Current Measures, Higher, and Lower scenarios where crude oil use is relatively stable over the projection period.
There are two main options for the region to obtain crude oil: marine vessel via ports along the St Lawrence Seaway and the Enbridge Mainline pipeline system. Some smaller volumes of crude oil may also reach the region by rail.
Currently, approximately halfFootnote 3 of central Canada’s 200 Mb/d of crude oil imports arrive by marine vessel, with essentially all those volumes coming from the U.S. The other half was the portion of crude oil produced in the U.S. that flowed on the Enbridge Mainline pipeline system.
It may be possible to reduce reliance on foreign crude oil imports and enhance self-sufficiency in the region by replacing some volumes imported by marine vessel with crude oil produced in Newfoundland and Labrador. Currently, most of Newfoundland and Labrador’s crude oil production, which was 210 Mb/d in 2024, is exported internationally, with nearly 60% destined to the U.S. and the remainder mostly going to Europe.
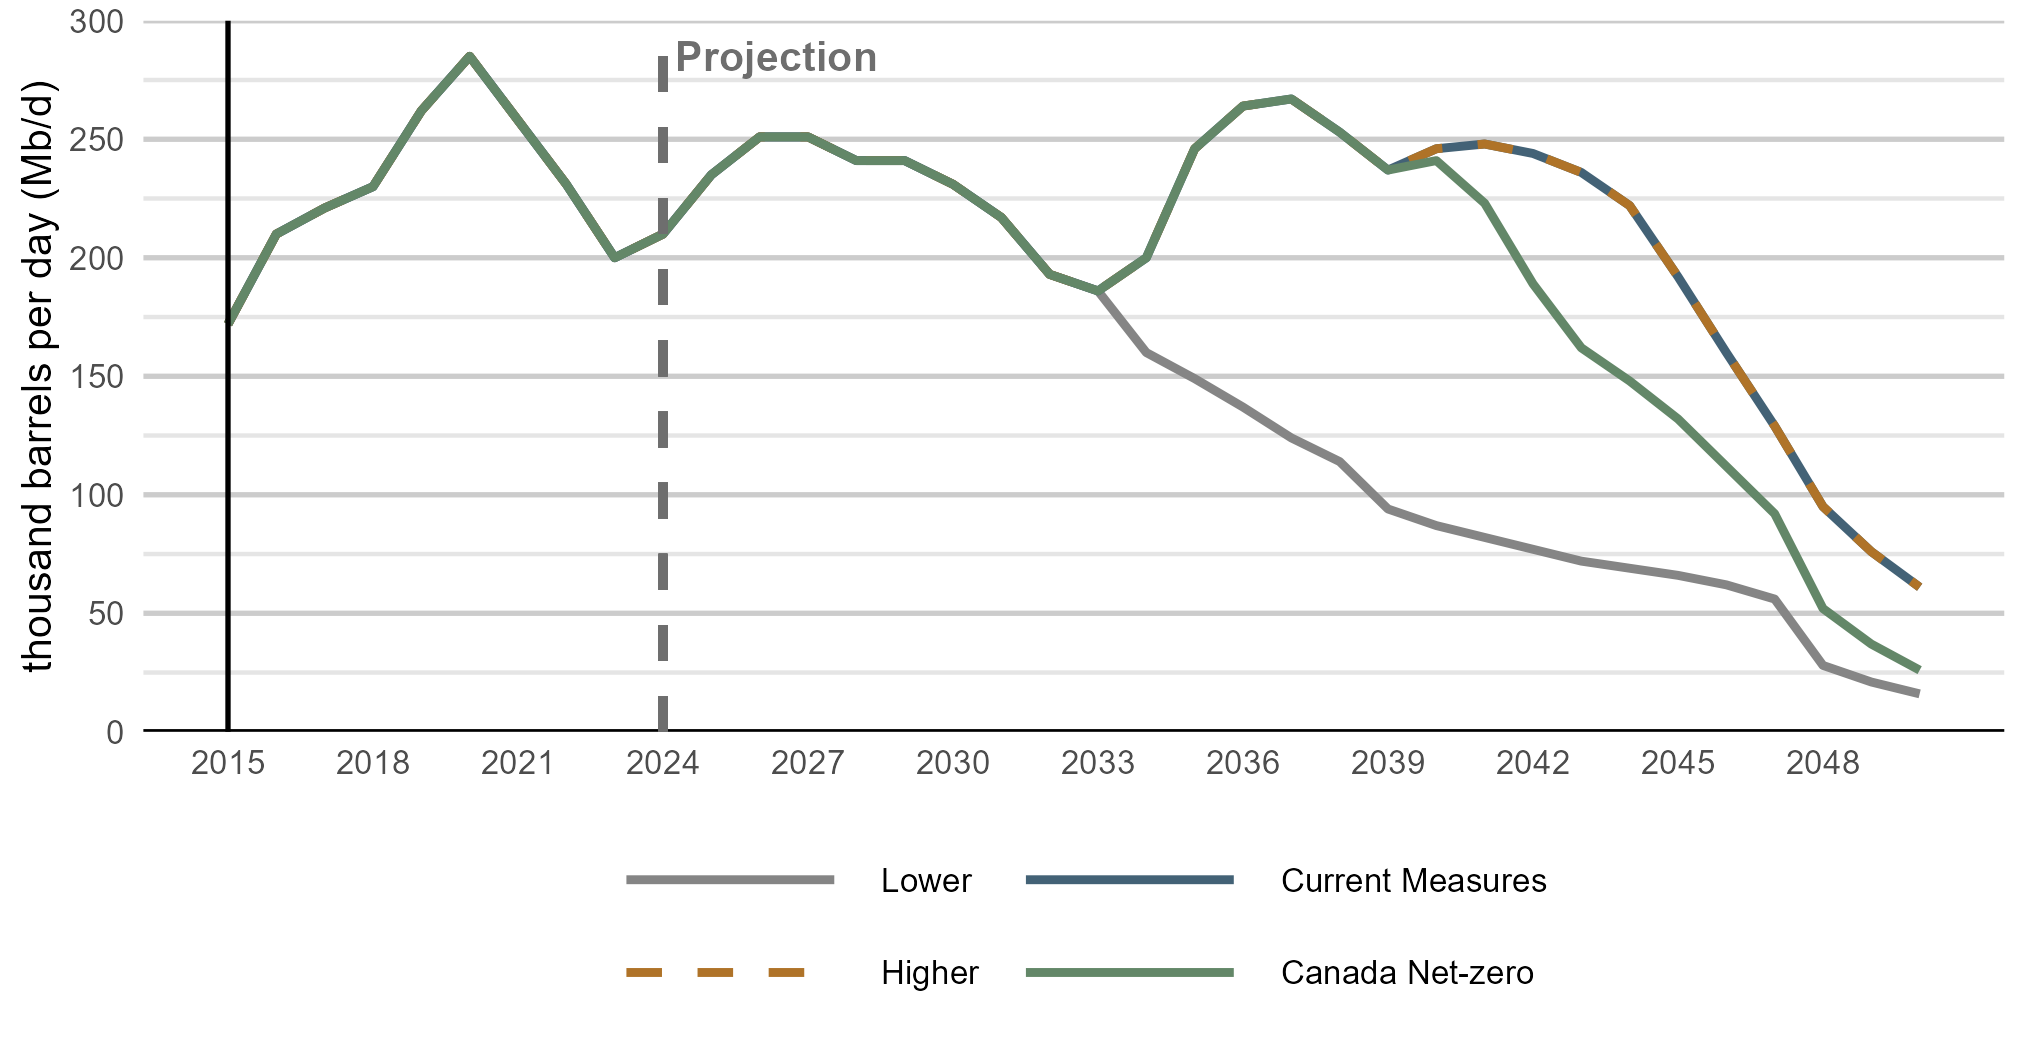
Text Alternative: This line chart shows Newfoundland and Labrador crude oil production from 2015 to 2050 across four scenarios. Production follows the same path in all scenarios through the early 2030s, increasing in the near term and reaching a near-peak in the mid-2030s in the Canada Net-zero and Higher scenarios. After this point, the scenarios diverge. Production remains highest in the Higher scenario, declines more moderately in Current Measures and Canada Net-zero, and falls most sharply in the Lower scenario by 2050.
As shown in Figure S.3, in Current Measures, crude oil production in Newfoundland and Labrador could partially offset import volumes to central Canada until around 2045 when production begins a natural decline. This drop occurs sooner in the Lower scenario. Offsetting imported crude oil with Newfoundland and Labrador production may require changes to the refining infrastructure in central Canada as the specifications of Newfoundland and Labrador production are somewhat different compared with the types of crude oil the refineries on Ontario and Quebec are optimized for.
Given the sustained level of RPP demand in the Current Measures, Higher, and Lower scenarios, there may also be potential to increase the amount of crude oil the region can source via marine vessel. Prior to 2014, most of the crude oil imported into Ontario and Quebec was from countries other than the U.S., with Algeria, United Kingdom and Norway being major sources. Total imports were also higher than current levels, averaging 494 Mb/d from 2000 to 2013, and as high as 590 Mb/d in 2005. During this period, the Enbridge Line 9 pipeline flowed east to west, meaning crude oil brought in via marine vessel could reach refineries all the way to southern Ontario. In two phases between 2013 and 2015, Enbridge Line 9 was reversed to flow west to east. While increasing imports of crude oil by marine vessel would not enhance the energy self-sufficiency of the region, it could allow greater diversification of import origins, which currently are entirely from the U.S. Significantly increasing volumes brought in via the St. Lawrence Seaway from current levels (either imports or volumes from Newfoundland and Labrador) would require infrastructure changes, including potentially reversing again, the flow of crude oil to move east to west on Enbridge’s Line 9.
The Enbridge Mainline system is the region’s other main source of crude oil. Beginning in Edmonton, Alberta, the system enters the U.S. in southern Manitoba. The system then runs through the U.S. making deliveries at refineries and interconnecting pipelines in the Great Lakes and Chicago regions before re-entering Canada at Sarnia in southwest Ontario. From Sarnia, the Enbridge Line 9 pipeline moves crude oil east to refineries in the region.
The Enbridge Mainline system includes a substantial segment that runs through the U.S., which is relevant in assessing the energy self-sufficiency of central Canada. As the main connection between western Canadian production and the region, an extended disruption on the system could create a significant challenge in meeting current and projected RPP demand. There is no crude oil pipeline that runs entirely within Canada that connects western Canadian production with eastern Canadian refineries. Connecting western Canadian crude oil supply to the region via a pipeline running entirely within Canada would require major new infrastructure.

RPP use in central Canada in the Current Measures, Higher, and Lower scenarios is relatively stable, falling gradually from 874 Mb/d in 2023, to 780 Mb/d in Current Measures, 842 Mb/d in the Higher scenario and 709 Mb/d in the Lower scenario by 2050. Average flows on the Enbridge Mainline pipeline system into central Canada averaged 750 Mb/d from 2019 to 2024, with monthly peak volume over that period closer 850 Mb/d. While RPP and crude oil volumes are not directly comparable, this suggests that the capability of the Enbridge Mainline to deliver into central Canada is roughly proportional in overall scale to RPP demand projected in the Current Measures, Higher and Lower scenarios.
In 2023, central Canada used 3.5 Bcf/d of natural gas, mostly in Ontario. Combined, the region’s consumption was roughly a quarter of total Canadian natural gas use. The main uses for natural gas in the region include space heating, power generation, and in industries like chemicals and iron and steel.
Imports of natural gas from the U.S. to central Canada have been stable between 1.6 and 1.7 Bcf/d over the past several years, representing just less than half of the region’s total gas use. Ontario and Quebec are part of a highly integrated North American natural gas market. The region receives natural gas from numerous pipelines originating in western Canada and the U.S.
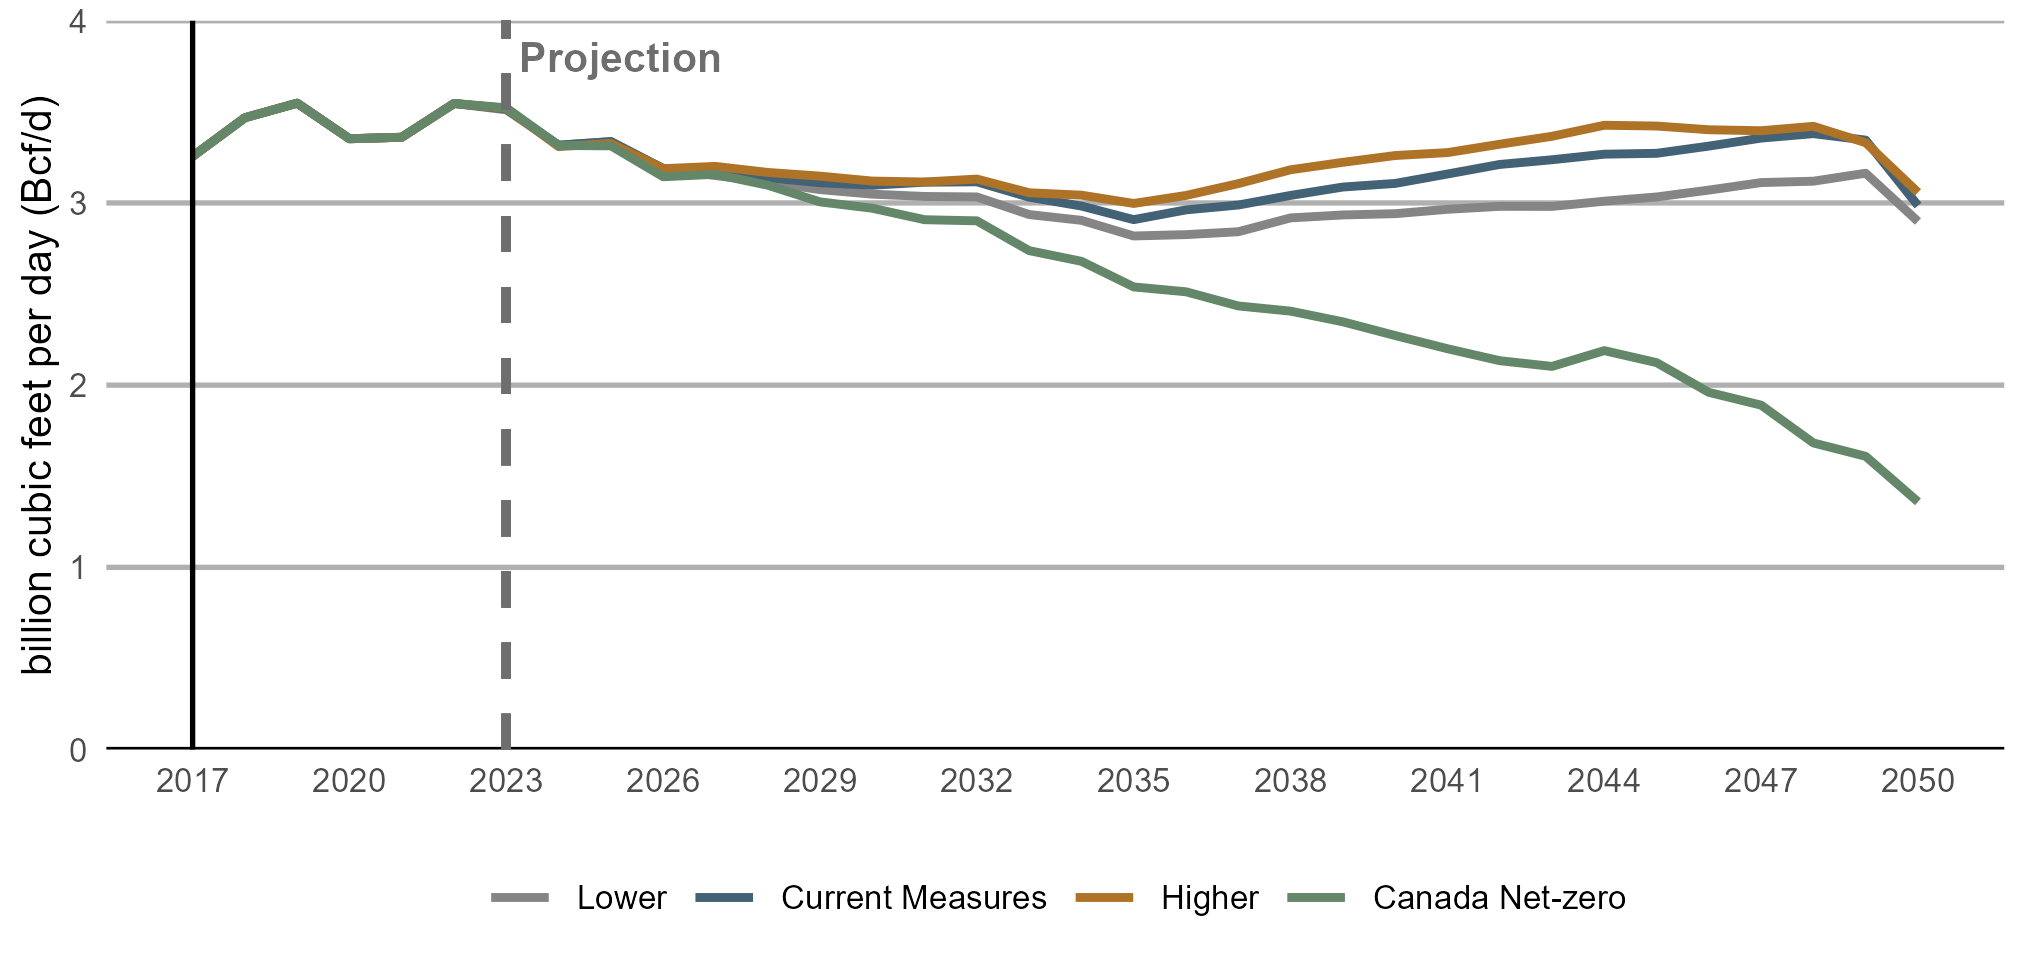
The projections of primary natural gas demand in central Canada follow similar patterns to the projections of Canada. As shown in Figure S.4, in the Current Measures, Higher and Lower scenarios, natural gas use declines gradually over the first decade of the projection period largely due to existing climate policies. Later, natural gas use begins to increase slightly, driven by growth in economic activity and power generation.
Text Alternative: This figure shows combined Ontario and Quebec primary natural gas demand in each of the scenarios. Demand is relatively stable over the projection period in the Current Measures, Higher, and Lower scenarios, declining slightly from 2025 to 2035 before climbing gradually through the remainder of the projection period. Demand in Canada Net-zero declines steadily throughout the projection period.
In Canada Net-zero, natural gas use in the region falls nearly two thirds from 2023 to 2050, reflecting the steady adoption of heat pumps for home heating and cooling, industrial electrification, and strong energy efficiency improvements. In this scenario, the need to bring natural gas from outside of central Canada is lower. Instead, some of the energy needs currently served by natural gas are met by locally generated electricity, which increases to meet higher demand. Lower reliance on external energy sources could enhance the region’s self-sufficiency in Canada Net-zero compared to the other scenarios.
In all scenarios, Canadian natural gas production remains high enough to meet future Canadian consumption. Production, which was at 18 Bcf/d in 2024, grows in all scenarios, reaching as high as 31 Bcf/d in the Higher scenario by 2050 and as low as 21 Bcf/d in Canada Net-zero.
Central Canada can source natural gas from western Canada and various producing regions in the U.S. The market operates in an integrated fashion, with natural gas moving in and out of Ontario and Quebec at different points via a significant network of natural gas pipelines.
The TC Energy Canadian Mainline (TC Mainline) is the largest pipeline system moving natural gas from western Canada eastward. The TC Mainline traverses the prairies before dividing into two segments in Manitoba: one that carries gas east, north of the Great Lakes, and one that carries gas south to the U.S. Natural gas exiting western Canada on other pipelines, such as Alliance or Foothills, can also make its way to Ontario and Quebec through interconnecting pipelines in the U.S.
The TC Mainline delivers natural gas to central Canada without traversing the U.S. This segment is referred to as the Northern Ontario line (NOL) segment and had a reported average annual capacity of 3.4 Bcf/d from 2019 to 2024, with throughput averaging 1.5 Bcf/d over the same period. Average throughput on the segment was closer to 2 Bcf/d in 2024, representing about 60% of the region’s total demand.
As shown in Figure S.4, in the Current Measures, Higher and Lower scenarios, natural gas use in the region remains near current levels throughout the projection period. In those scenarios, central Canada’s energy self-sufficiency could be enhanced by increasing the amount of natural gas produced in Canada used in the region, particularly if it is delivered via a route entirely within Canada. Increasing natural gas volumes on the NOL segment offers potential to do so but would depend on whether there is capability to increase volumes on the segment in the future.
In the past, volumes on the NOL segment have been higher, up to 3.2 Bcf/d in 2006. However, since 2006 there have been changes to the system, including the conversion of one of the lines of the prairies segment of the pipeline from natural gas to oil service as part of the Keystone oil pipeline in 2008. While recently reported NOL capacity was well above throughput, significantly increasing NOL throughput may not be feasible due to system constraints upstream or downstream of the segment. For example, the NGTL system, which gathers natural gas in Alberta and northeast B.C., is largely at full capacity at the point where it delivers natural gas to the TC Mainline at the Alberta/Saskatchewan boundary. It is likely that significantly increasing the amount of NOL-delivered western Canadian natural gas used in central Canada would require infrastructure investments, potentially both upstream and downstream of the NOL segment.
Diverse transportation infrastructure systems are important to the security of central Canada’s RPPs, crude oil, and natural gas supply. Western Canada and the U.S. are the main sources of the region’s crude oil and natural gas.
For both crude oil and natural gas, central Canada’s access to western Canadian production relies on major pipeline systems moving volumes from west to east. Currently, a significant share of the region’s needs is met by western Canadian crude oil and natural gas, though much of that supply arrives via pipelines that transit through the U.S. In addition, imports of those commodities from the U.S. play a significant role. In the Current Measures, Higher and Lower scenarios, total demand for RPPs and natural gas is relatively stable near current levels throughout the projection period. Both major pipeline systems delivering crude oil and natural gas to the region are likely currently operating near their full capability to deliver volumes into eastern Canada, implying that the region’s energy security would not significantly change absent major infrastructure changes.
In Canada Net-zero, demand for RPPs (and hence crude oil) and natural gas, decline sharply over the projection period. This could enable the region to reduce the need to rely on foreign energy sources and Canadian energy delivered through the U.S. In this scenario, shifting the energy mix to a higher share of energy produced within the region, like electricity and hydrogen, could enhance energy self-sufficiency in Ontario and Quebec.

As described in the Electricity section of the Results chapter, all scenarios project electricity generation growing more quickly in the future compared to the past 20 years. In Current Measures, electricity generation grows by nearly 50% from 2024 to 2050, and more than doubles in Canada Net-zero.

Expanding Canada’s electricity system to meet growing demand will require significant levels of investment. It will also rely on a complex supply chain to produce the components and materials required to facilitate this expansion.
The following section contextualizes the electricity supply projections by exploring the capital and repair expenditure requirements associated with the scenarios and quantifying the electricity component demands, such as solar panels or gas turbines, implied by the projections. The analysis also looks at the material requirements, such as copper, silicon and other critical minerals, used to build those components.
Growing Canada’s electricity supply as depicted in all scenarios will require considerable investment, with cumulative capital and repair expenditures from 2025 to 2050, ranging from as high as $2025 1.2 trillion in the Higher and Canada Net-zero scenarios and $2025 785 billion in the Lower scenario.
These investments will depend on a complex global supply chain to produce physical components such as solar panels or natural gas turbines. The manufacturing of those components, and the extraction and processing of materials required to manufacture them, is often highly concentrated in individual countries, which is a risk to the resiliency of the supply chain.
Future growth in Canada’s demand for electricity system components is relatively modest compared to the total size of the global capacity to produce those components. However, if the trend of growing electricity use around the world continues and possibly accelerates, there is potential for supply chain challenges to impact the cost and availability of different technologies. Canada plays a role in producing several of the minerals that are important inputs to the global electricity component supply chain, so increasing Canadian and/or global investments could present opportunities as well.
Electricity grids are interconnected systems of physical components working in tandem to ensure reliable delivery of electricity. These components can include generating facilities, transmission lines, transformers, control and communication systems, and distribution infrastructure. Figure S.5 depicts the key elements of an electricity grid.
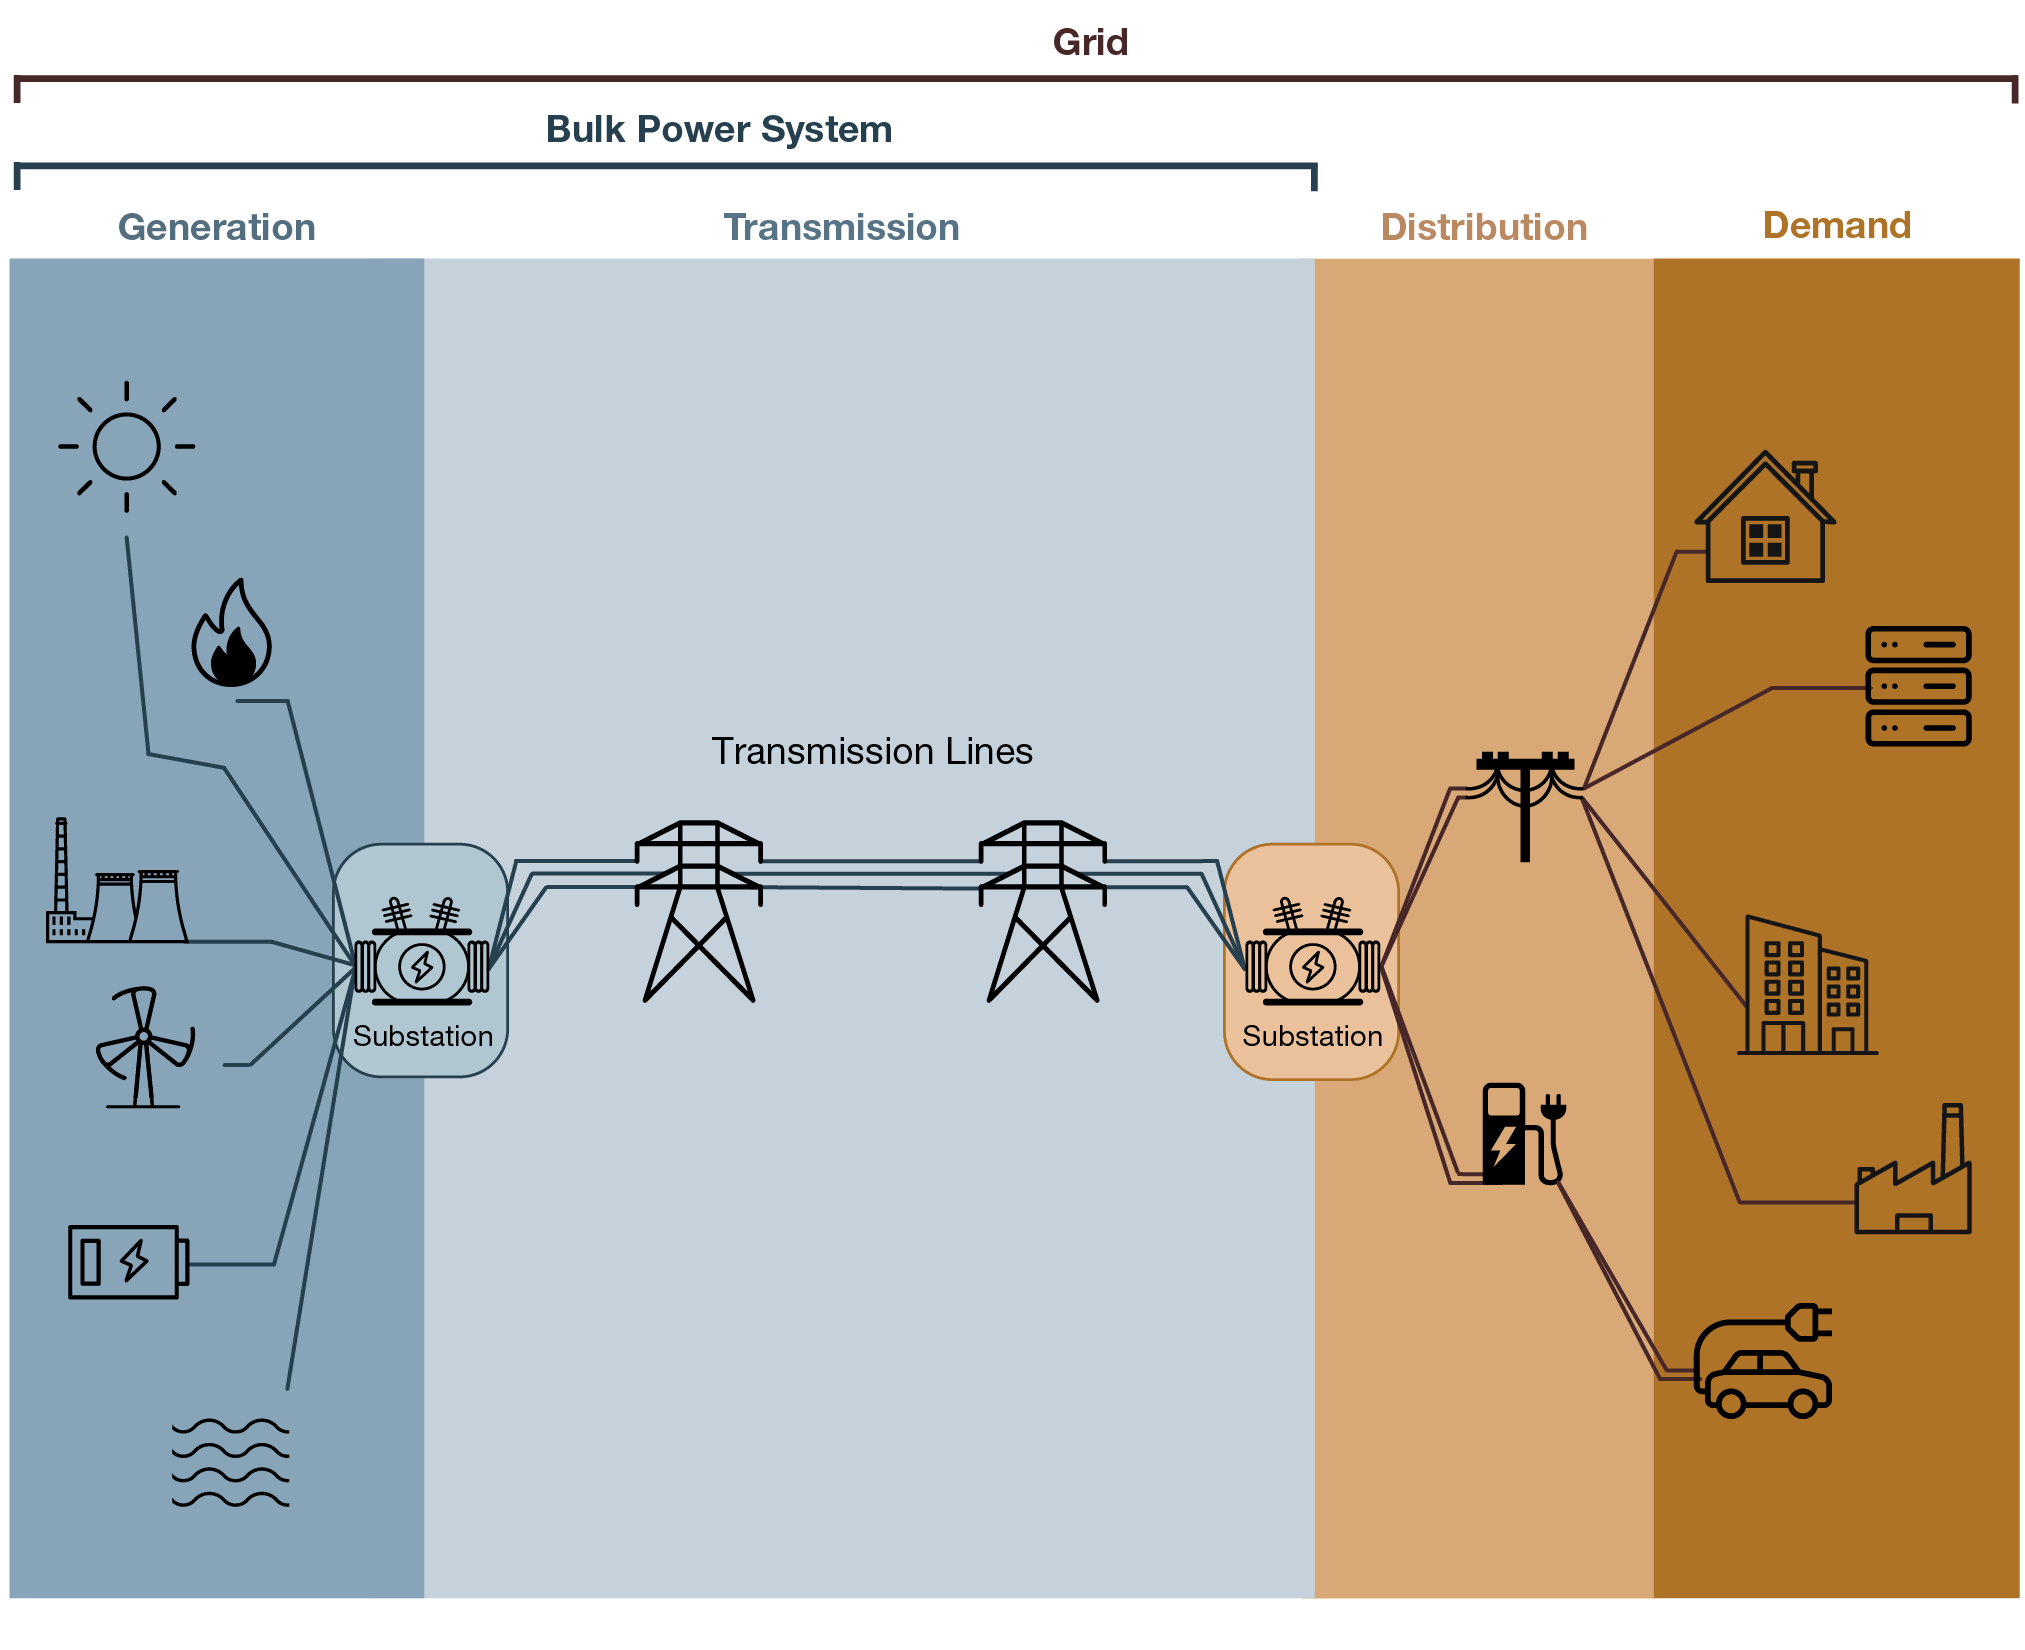
Text Alternative: This figure illustrates the main elements of a typical power grid. The diagram shows electricity flowing from generation sources, through substations and high-voltage transmission lines, to distribution networks, and ultimately to end-use demand. Generation includes a mix of sources, transmission connects generation to load centers, distribution delivers electricity locally, and demand includes residential, commercial, industrial, and transportation uses.
How investments in new electricity generation and transmission are made varies by province and territory. Expenditures on maintaining or growing each electricity system are, in general, ultimately paid for by those that use the electricity through the rates they pay.
Capital and repair expenditures in Canada’s electricity sector, including expenditures on new assets like generating facilities, transmission lines and distribution systems, as well as specific repair and maintenance activities, averaged $2025 32 billion from 2006 to 2023, growing at an annual average rate of 3.7% over that period.
Our estimates of capital and repair expenditures over the projection period are not directly comparable to the available data from Statistics Canada, with estimates representing a subset of the available historical data. Our estimates exclude expenditures on the distribution system and transmission lines other than those built to connect new generation to the system or between provinces. This is because our electricity model focuses on the bulk power system and excludes a detailed representation of the distribution system and certain transmission types.

Even though our projections of capital and repair expenditures exclude a portion of the expenditures reported in the historical data, the estimates of capital and repair expenditures in all but the Lower scenario are higher than the historical data from the past two decades despite their inclusion of all investment in the electricity sector. Average annual capital and repair expenditures in Current Measures is $2025 37 billion from 2025 to 2050 ($2025 962 billion cumulatively) and $2025 46 billion in the Higher and Canada Net-zero scenarios ($2025 1.2 trillion). In the Lower scenario, capital and repair expenditures average $2025 30 billion per year, or $2025 785 billion cumulatively. Our assumptions regarding capital costs influence the capital expenditure estimates: while total installed capacity increases almost two thirds as much from 2025 to 2050 in Canada Net-zero compared to Current Measures, cumulative expenditures over the projection period in Canada Net-zero are only 25% higher.
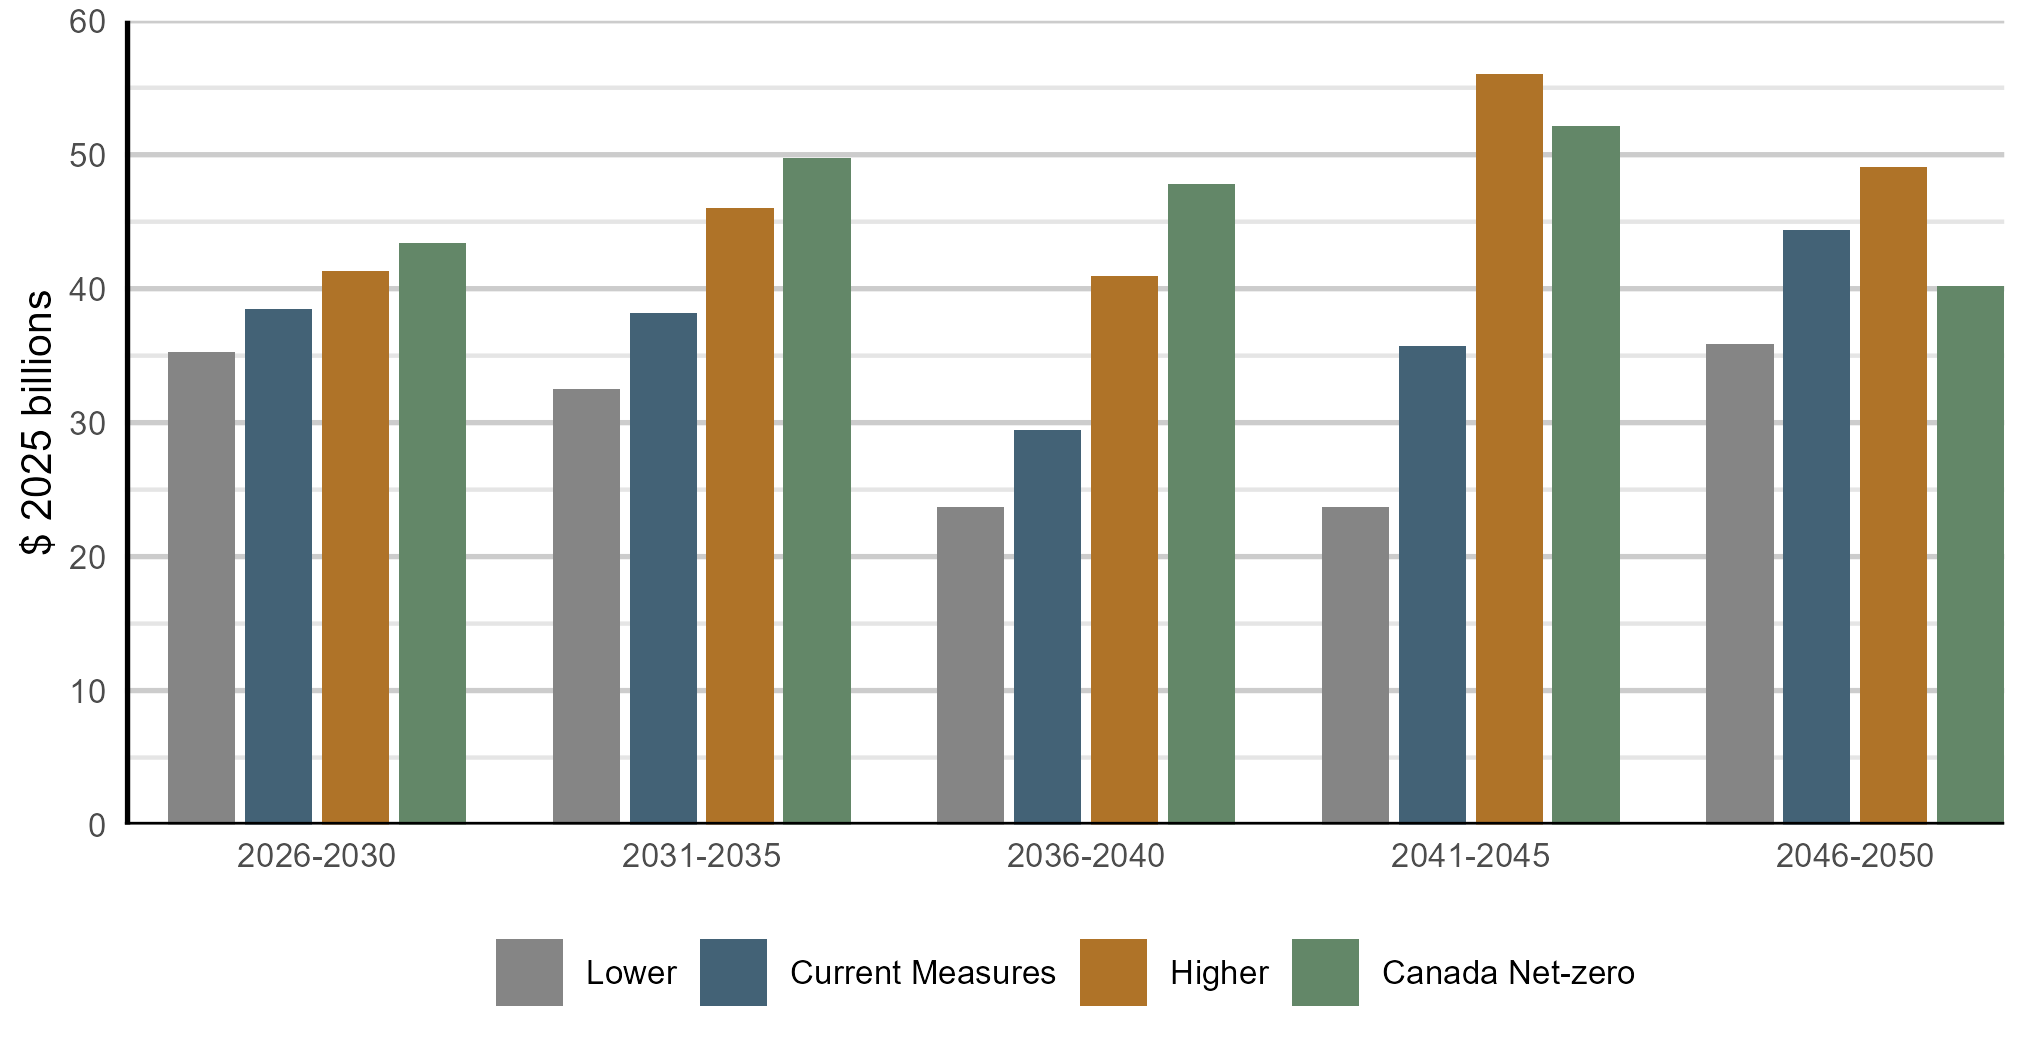
Figure S.6 shows average annual capital and repair expenditures in 5-year increments for each of the four scenarios. Expenditures on the distribution system and certain transmission types are excluded.
Text Alternative: This bar chart shows average annual investment in the electricity system across all scenarios, presented in five-year increments from 2026 to 2050. Investment levels vary by scenario and over time. Across all periods, investment is lowest in the Lower scenario and highest in the Canada Net-zero and Higher scenarios, with investment levels changing across periods within each scenario.
In all four scenarios, capital and repair expenditures are relatively high in the first decade of the projection periods as utilities and companies add capacity to accommodate demand growth as well as reduce the emission-intensity of their generation fleets. After that, expenditures remain high in the Higher and Canada Net-zero scenarios, reflecting higher electricity use in those scenarios. Expenditures slow in the Current Measures and Lower scenarios from 2036 to 2045 and then increase again near the end of the projection period to accommodate continued demand growth, replacement of retiring assets, and further emission reductions.

The price consumers pay for electricity in the modeling is based on the projections of total electricity system costs, which includes capital and repair expenditures and operating costs of facilities, as well as assumptions related to the cost of delivering electricity to consumers. These prices in turn influence our other models. In general, electricity prices rise in all four scenarios but at a pace similar to the increase over the past 30 years. Average Canadian electricity prices increase slightly faster than the rate of inflation in the Current Measures, Higher and Lower scenarios, and slightly slower in Canada Net-zero. Prices are lowest in Canada Net-zero despite having the highest electricity demand growth, largely due to lower capital cost assumptions for clean electricity technologies in that scenario.
Given the importance of electricity systems to modern economies, governments around the world are placing greater strategic importance on the components and materials that make up these systems, including the resiliency of the supply chains. The following section quantifies what the projections imply about the need for these inputs in Canada and explores the resiliency of the supply chain required to support those projections.
The supply of the physical components that make up electricity grids depends on a complex and interconnected supply chain. The manufacturing and resource extraction and processing activity to produce these components is global in nature. However, in many cases, these activities are often concentrated in specific countries. For example, according to the International Energy Agency (IEA), China accounts for more than 80% of solar module manufacturing capacity and 70-80% of wind turbine blades. Likewise, production of some key raw materials like chromium (South Africa, 45%), silicon (China, 85%) and cobalt (Congo, 76%) are highly concentrated in individual countries according to the U.S. Geological Survey. Market concentration in the refining and processing of raw materials is also high, with China dominating many minerals, including 70-75% of global lithium and cobalt processing and over 90% for rare earth elements and battery-grade graphite, according to the IEA.
A high degree of concentration of these activities in one or a few countries can make a supply chain less resilient. Changes to trade practices, geopolitical events or natural disasters in one region can result in greater shortages or more rapid price increases compared to a more diversified supply chain.
Accelerating the growth of Canada’s electricity supply requires more physical assets to be installed. Table S.1 shows the cumulative number of components installed in Canada from 2025 to 2050 implied by the capacity expansions projected in Current Measures and Canada Net-zero.
| Component | Estimated cumulative quantity installed, 2025 to 2050 | |
|---|---|---|
| Current Measures | Canada Net-zero | |
| Solar (total surface area of panels) |
105 km2 | 97 km2 |
| Onshore wind turbines (reference capacity of 5.5 MW) |
10,718 | 17,511 |
| Offshore wind turbines (reference capacity of 15 MW) |
73 | 89 |
| Lithium batteries (reference battery stack size of 4.5 MWh) |
5,324 | 6,620 |
| Gas turbines (reference capacity of 100 MW) |
124 | 131 |
| Gas turbines with CCUS (reference capacity of 100 MW) |
74 | 89 |
On its own, faster growth of Canadian electricity systems will likely have limited impact on the global electricity component supply chain as Canada is a relatively small purchaser compared to the global market. However, accelerated electrification globally could compound pressure on the global supply chain, and in turn could affect the timeliness and cost of acquiring new electricity system components in Canada.

Domestically, accelerating growth in electricity system installations could create other challenges. For example, it could be challenging to access enough skilled labour involved to construct these facilities. A report by the Electricity Human Resources Canada projected that job openings in the electricity sector could be between 17,000 and 28,000 from 2023 to 2028 (compared to total employment of 110,600 in 2022) driven by new positions and retirements of existing employees. While this represents an opportunity for job creation, acute labour shortages could affect the timelines and costs of bringing new generation online.
Manufacturing electricity system components requires a wide variety of materials. For example, manufacturing a solar panel requires materials like aluminum, silicon and copper. Table S.2 quantifies the demand for a subset of key materials required by the new installations of electricity components implied by the projections. Several materials listed in Table S.2 are on the Government of Canada’s critical mineral list.
| Material | Estimated cumulative tonnes used, 2025 to 2050 | |
|---|---|---|
| Current Measures | Canada Net-zero | |
| Aluminum | 398,165 | 443,853 |
| Concrete | 24,746,609 | 39,848,627 |
| Copper | 365,398 | 564,733 |
| Dysprosium | 638 | 1,034 |
| Glass and carbon fibre composites | 453,090 | 735,740 |
| Graphite | 101,429 | 126,420 |
| Lithium | 9,269 | 11,580 |
| Neodymium | 7,838 | 12,725 |
| Praseodymium | 1,188 | 1,925 |
| Silicon metal | 78,053 | 72,733 |
| Solar glass | 1,003,945 | 935,230 |
| Steel | 8,099,356 | 12,109,150 |
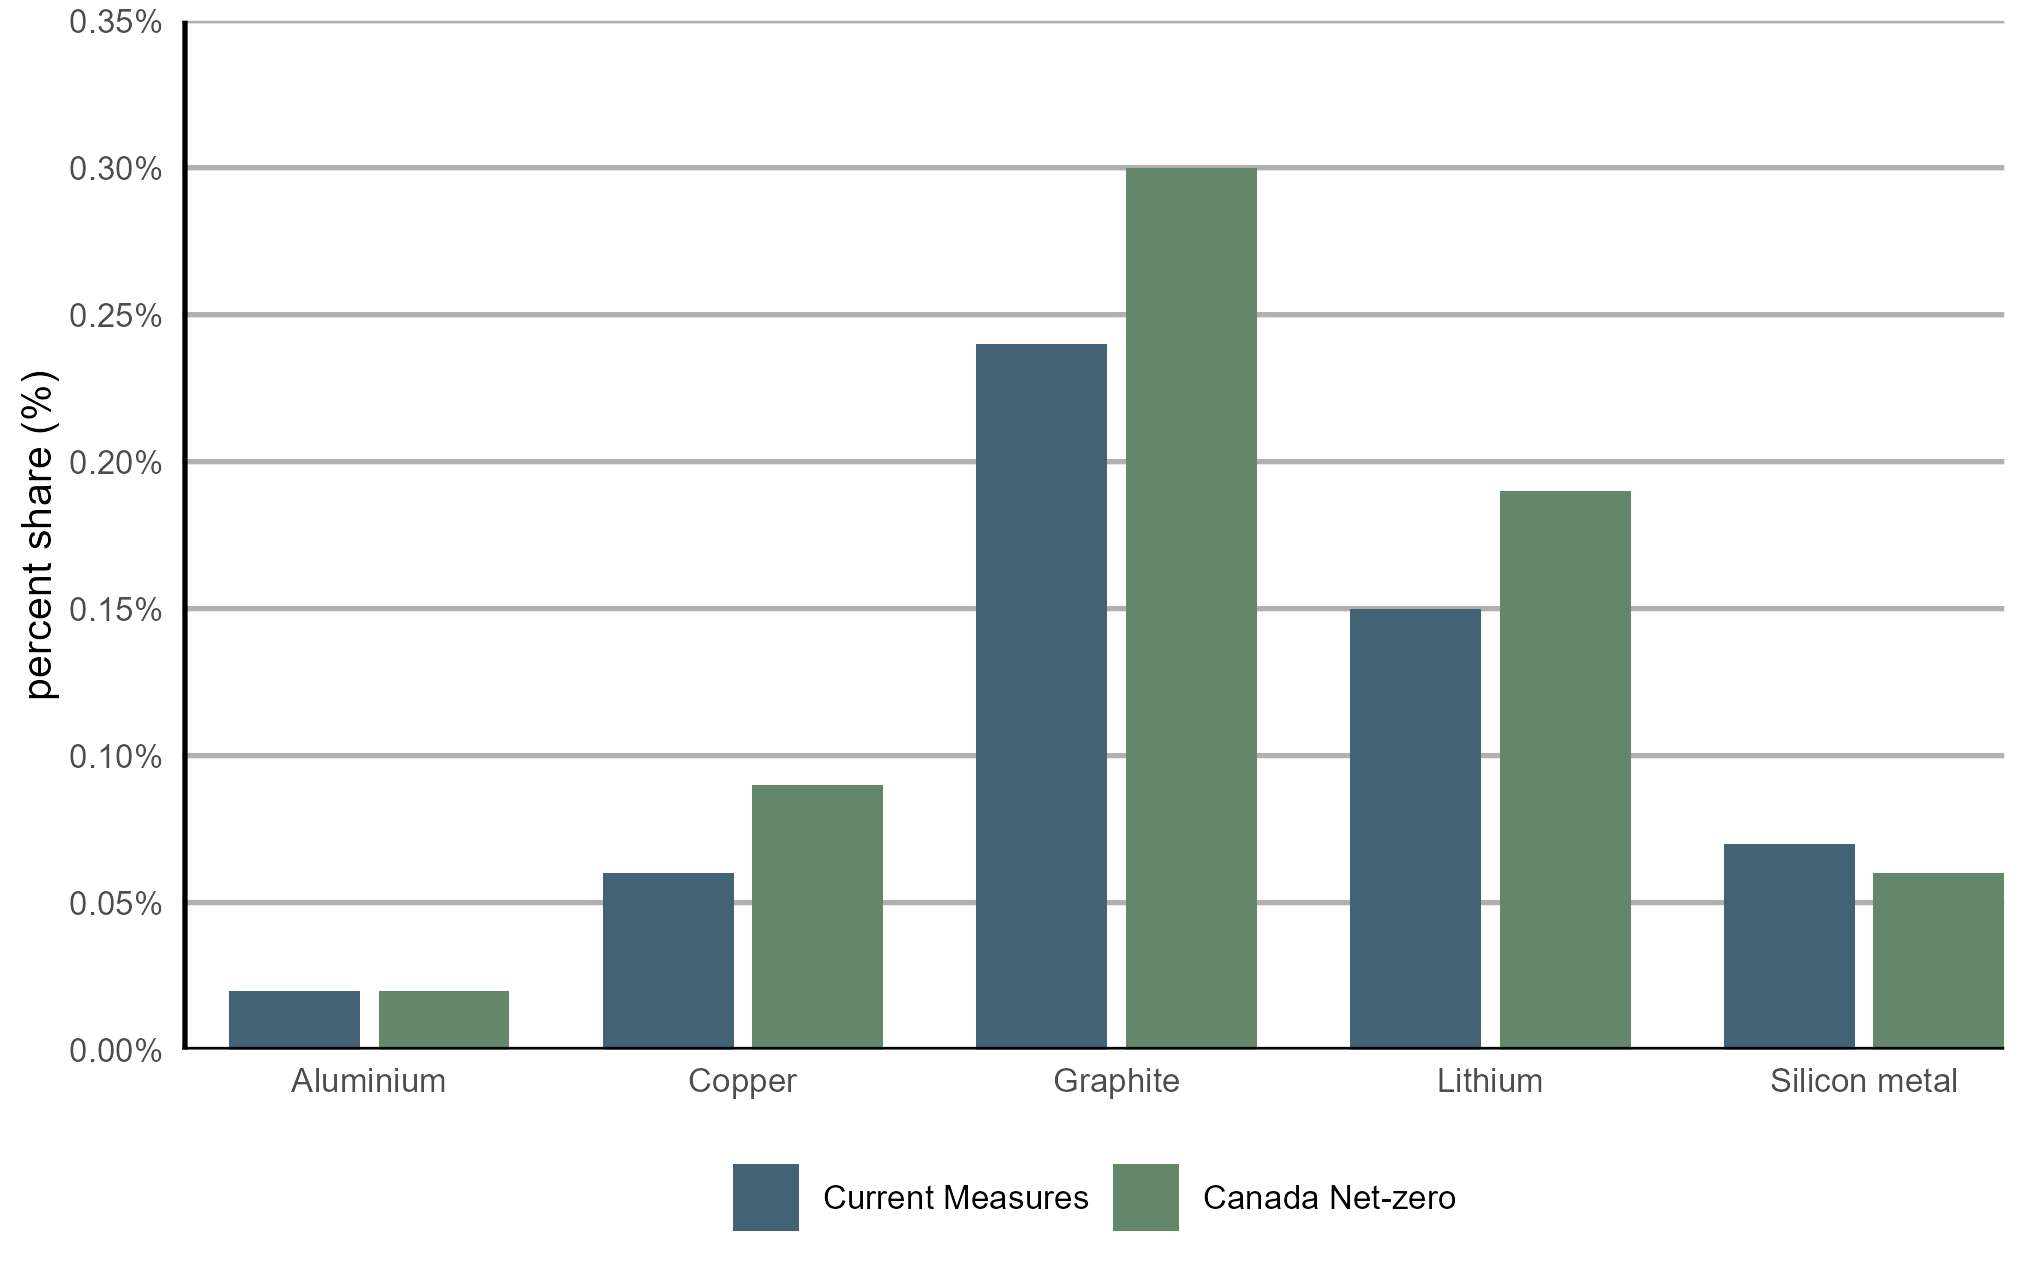
To contextualize the material use associated with projections, Figure S.7 shows the average annual requirements of some of the materials in Table S.2 compared to global production of those materials in 2024. This comparison provides a sense of how large the implied demand for materials compares to current availability.
Text Alternative: This bar chart shows annual implied material demand from 2025 to 2050 in the Current Measures and Canada Net-zero scenarios, expressed as a percentage of 2024 global production for selected minerals. The chart presents individual bars for each material. The share of global production varies across materials, ranging from 0.02% for aluminum, to 0.3% for graphite.
Canada plays a role in producing several of the minerals that are important inputs to the global electricity component supply chain, including nearly 5% of global aluminum smelter production in 2024, as well as notable quantities of copper, cobalt, lithium and graphite. Canada’s Critical Mineral Strategy aims to increase the supply of Canadian critical minerals with a focus on objectives like economic growth, competitiveness, climate action and advancing Reconciliation with Indigenous peoples. Given that production of many critical minerals is concentrated in a handful of countries, increasing diversity of producing regions, including Canada, could enhance the resiliency of the global electricity component supply chain and Canada’s access to those components.

Building the electricity infrastructure projected in this report will require an acceleration of investment and installation of electricity grid components. The impact of this acceleration in Canada is relatively modest compared to the total size of the global capacity to produce these components. However, if the trend of growing electricity use around the world continues and possibly accelerates, there is potential for supply chain challenges. This could affect Canadian utilities and businesses’ ability to grow Canada’s electricity supply at the cost and timeframes projected in this report.
The supply of some components and input materials is concentrated in one or a few countries, reducing the resiliency of these supply chains. Canada plays a role in producing several of the minerals that are important inputs to the global electricity component supply chain, so increasing Canadian and/or global investments could present opportunities as well. In addition, some of the materials critical to growing electricity systems have become increasingly important from a geopolitical perspective, adding complexity to the situation.
Canada is a trade-oriented economy, with exports equal to around 30% of its economic output. Over three quarters of the value of Canada’s exports went to the U.S. in 2024, including 94% of motor vehicles and parts, 82% of forest products, and 57% of metal and mineral products. Exports of Canada’s crude oil have been even more concentrated, with over 95% going to the U.S. in 2024. The proximity of the U.S. and the size of its economy have been drivers of why so many of Canada’s exports are sent south of the border. Strong diplomatic ties, including agreements to reduce trade barriers, have also driven this trend.
In general, diversity in trading partners is beneficial to exporters. This is because disruptions in one market, such as logistical bottlenecks or changes to trade policy, are less impactful to exporters if they have alternative markets.
Recently, changing trade and geopolitical drivers have increased interest in diversifying export markets. This section explores what the crude oil projections in the report may mean for the potential for future crude oil trade diversification.
With the production projections in this report, there is somewhat limited potential to diversify Canada’s crude oil exports given the extent of existing infrastructure that is oriented towards the U.S. An illustrative comparison of crude oil export capacity—existing, or part of a planned expansion, with a final corporate investment decision—to crude oil available for export from western Canada shows a range of potential outcomes across scenarios, with some showing crude available for export exceeding available export capacity and others remaining below it. In light of the markets served by that capacity, more significant diversification of Canada’s crude oil trade could result if supply ends up being higher than what is projected in our scenarios, or if new pipeline capacity to global markets diverts volumes away from U.S. markets.
Canada is the 4th largest crude oil producer in the world, behind the U.S., Saudi Arabia and Russia. Canadian crude oil production hit a record high of 5.1 MMb/d in 2024. The vast majority of Canadian crude oil is produced in Alberta, followed by Saskatchewan, offshore Newfoundland and Labrador, and B.C.
Canada’s crude oil export infrastructure has developed with the U.S. as its primary customer, with only one of Canada’s major export pipelines, the Trans Mountain System, providing direct access to global markets via marine vessel. After transiting the U.S. on the Keystone, Enbridge Mainline or Express pipeline systems, some Canadian crude oil has, at times, also been re-exported to global markets via ports on the U.S. Gulf Coast. In addition, essentially all of Newfoundland and Labrador’s offshore production is exported by marine vessel, allowing access to a range of international markets.
Table S.3 shows the pipelines exiting western Canada, their capacities, the key markets they serve, and the key assumptions for Figure S.8 found later in this section. More information on these pipelines is available on the CER’s Pipeline Profiles.
| Pipeline | Estimated existing takeaway capacity (Mb/d)Footnote 4Footnote 5Footnote 6 | Downstream markets |
|---|---|---|
| Enbridge Canadian Mainline System |
3227 Mb/d Assumptions for the purposes of Figure S.8: Capacity was reduced from the above amount by 80 Mb/d to account for the estimated flow of NGLs on the system. Capacity was also reduced by 33 Mb/d to account for the estimated amount of crude oil produced in North Dakota that enters the system within Canada (both reduce the space available to ship western Canadian crude oil). Capacity was increased by 150 Mb/d in 2027 to reflect Enbridge’s planned Mainline Optimization Phase 1 expansion (final investment decision announced on November 14, 2025) |
U.S. Midwest and interconnecting pipelines serving other parts of the U.S., particularly the Gulf Coast. A segment of the Enbridge Mainline also re-enters Canada at Sarnia, Ontario. Some crude oil shipped on the system may be re-exported to global markets via marine vessel in the U.S. Gulf Coast. |
| Trans Mountain System |
887 Mb/d Assumptions for the purposes of Figure S.8: Capacity was reduced by 44 Mb/d from the amount above to account for the RPPs that flow on the line (reducing space available for crude oil). |
B.C. and Washington State, and marine vessel with access to global markets. |
| Keystone |
622 Mb/d Assumptions for the purposes of Figure S.8: Although capacity on Keystone in 2025 was affected by a pressure restriction imposed by the U.S. Pipeline and Hazardous Materials Safety Administration, the system’s nominal capacity of 622 Mb/d was used for 2025 and onwards. |
U.S. Midwest and Gulf Coast. Some crude oil shipped on the system may be re-exported to global markets via ports on the U.S. Gulf Coast. |
| Express |
310 Mb/d Assumptions for the purposes of Figure S.8: Capacity was increased from the above amount by 30 Mb/d in 2027 to reflect a planned expansion (final investment decision announced on November 7, 2025) |
U.S. Rockies region and other downstream U.S. locations. Some crude oil shipped on the system may be re-exported to global markets via ports on the U.S. Gulf Coast. |
| Milk River | 98 Mb/d | U.S. Rockies region. |
| Aurora/Rangeland | 45 Mb/d | U.S. Rockies region. |
| Rail |
Structural Rail: 77 Mb/d Actual rail exports, which at times have included variable rail volumes in addition to structural rail, are shown in the historical period in Figure S.8. Structural rail capacity of 77 Mb/d was used from 2025 to 2050. |
Rail can provide access to a variety of U.S. markets, including some areas not served by pipeline systems. Structural rail represents crude-by-rail volumes that persist due to lack of pipeline connectivity for producers in Canada or refineries in the U.S. Crude oil exports by rail can be much higher than the structural rail amount, and have reached as high as 412 Mb/d in the past, in response to periods of aggregate pipeline capacity shortfalls (i.e. variable rail). |
Some of Canada’s crude oil exports are moved by rail, though it is generally more expensive than transportation by pipeline. In 2024, crude oil exports by rail averaged 89 Mb/d. Exports by rail can be sent to most regions in the U.S.
A key challenge facing western Canadian crude oil exporters over the past decade has been that growth in crude oil production has, at times, outpaced the availability of export pipeline capacity. Periods of constrained pipeline capacity relative to crude oil supply have contributed to periods where the price difference, or price differential, between crude oil prices in western Canada, such as Western Canadian Select (WCS), and benchmark international prices, such as West Texas Intermediate (WTI), has widened.
When export pipeline capacity is not constrained relative to crude oil supply, the differential typically reflects the cost to ship crude oil by pipeline and any differences in quality of crude oil types. In these circumstances, the WTI price is typically around US$12.50/bbl higher than WCS. During periods of tight pipeline capacity, the differential has widened to US$25/bbl or more, putting downward pressure on producer and government revenues. The expansion of the Trans Mountain system in 2024 helped alleviate tight pipeline capacity. Crude oil producers and shippers generally consider a cushion of spare export pipeline capacity to be beneficial, helping to avoid periods of tight capacity and high price differentials.
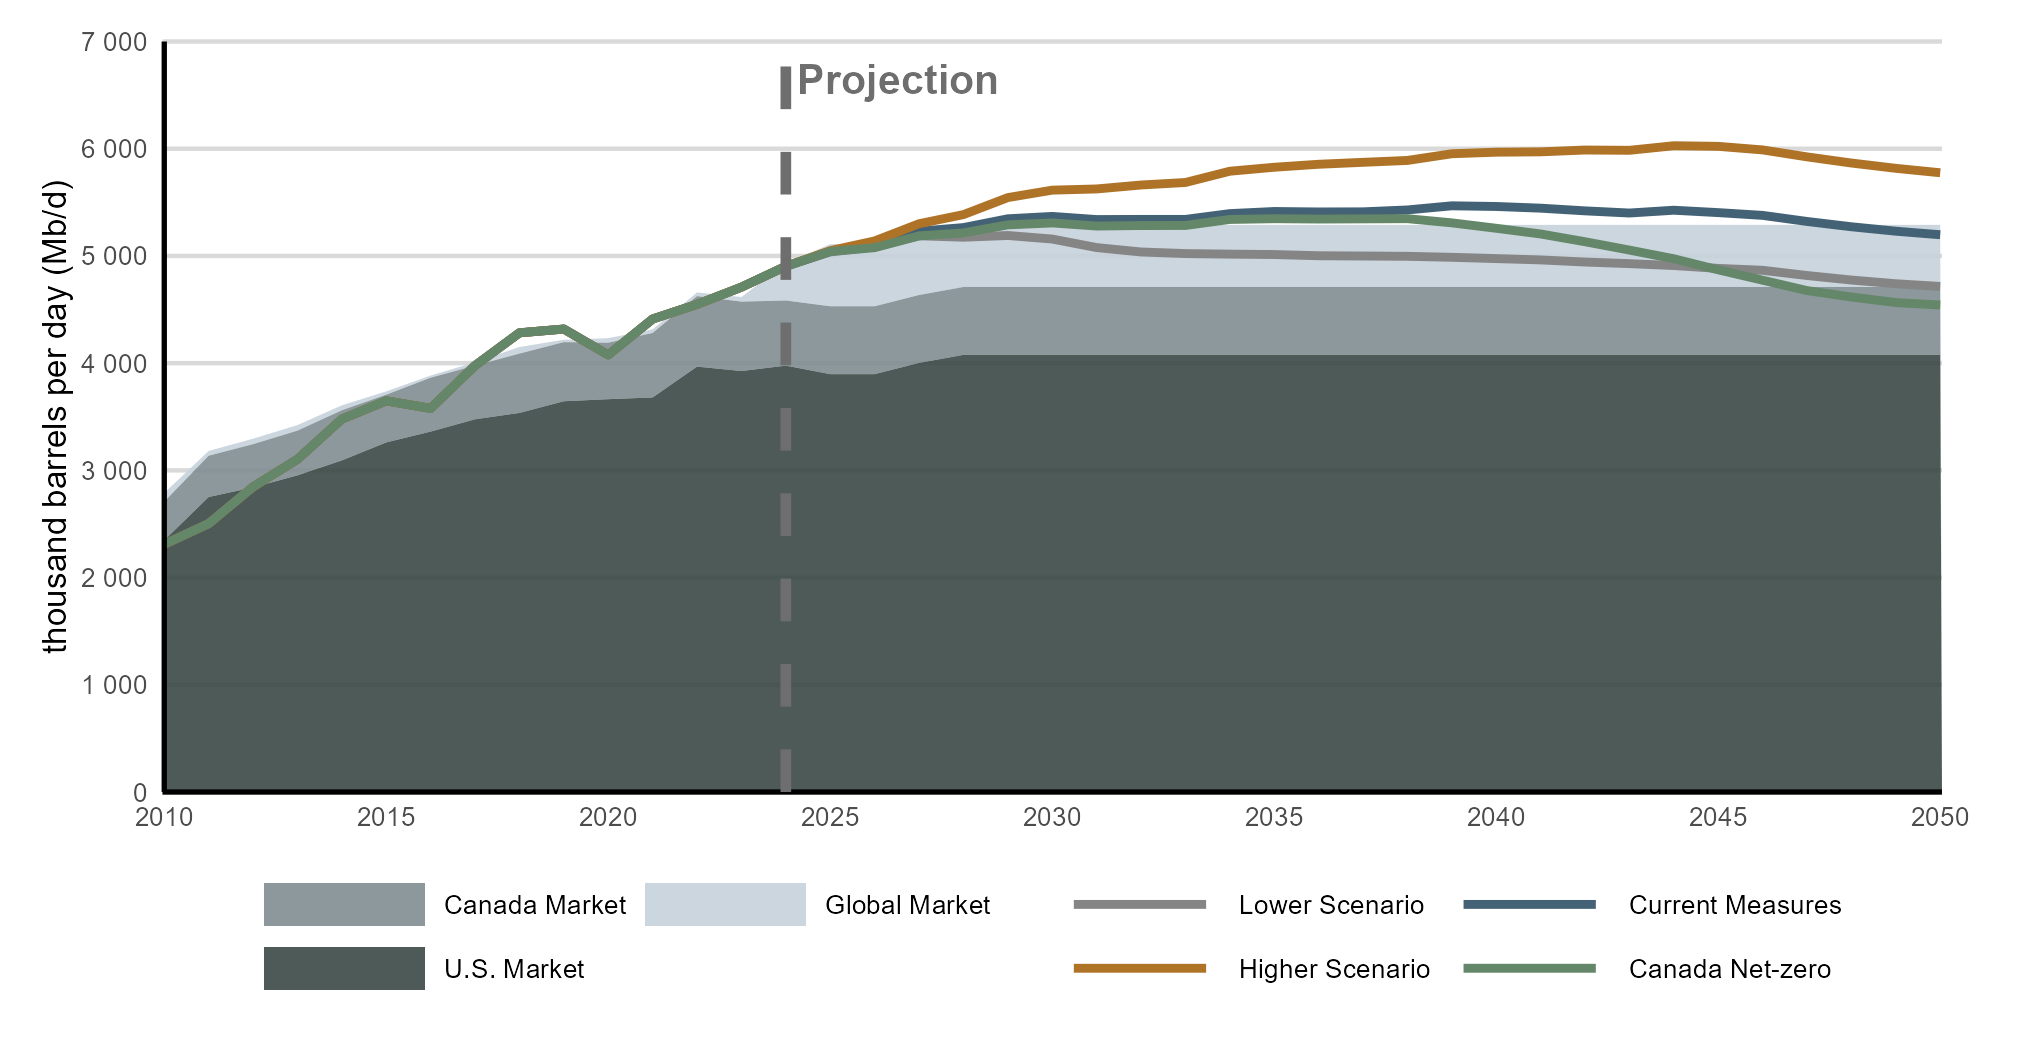
Figure S.8 is a simplified comparison of projected western Canadian crude oil supply available for export in all four scenarios and an illustrative level of total export capacity from existing pipelines, planned pipeline expansions, and structural rail. Crude oil available for export is defined as crude oil production in western Canada less the crude oil used in refineries in Alberta and Saskatchewan. It refers to crude oil available to be moved out of western Canada, whether it is moved to other parts of Canada, the U.S. or global markets. Crude oil available for export also includes diluent blended with both bitumen and heavy crude oil to facilitate their flow on pipelines. Only planned expansions for which companies have reached public final investment decisions by the end of November 2025 are included in Figure S.8. Importantly, inclusion here has no bearing on any regulatory approvals, including by the Commission of the CER, nor does it suggest any particular outcome of regulatory processes.
It is important to note that future available capacity could be higher or lower than reflected in Figure S.8. This is because projects that have not reached final investment decision or have not yet been announced are not included –such as additional expansions being considered to the Enbridge Mainline and Trans Mountain systems, or the pipeline project referenced in the Canada-Alberta Memorandum of Understanding (i.e. one or more pipelines with a route that increases export access to Asian markets as a priority). Also, currently existing pipelines could be decommissioned. As a result, a depiction of the crude oil available for export above, or below, the total capacity shown in Figure S.8 does not indicate the extent to which any existing or additional pipeline capacity would be utilized or not.
The Illustrative export capacity shown in the figure is segmented by the potential markets accessible through reliance on existing infrastructure and planned expansions for which companies have reached public final investment decisions. The U.S. portion of the figure represents only the capacity of pipelines shipping directly to the U.S. and excludes any potential exports reaching U.S. markets via marine vessels leaving Trans Mountain’s Westridge marine terminal (rather, that capacity is all included in the global portion). Similarly, the global portion of the figure does not include any capacity to re-export Canadian crude oil from the U.S. Gulf Coast after moving on pipelines shipping directly to the U.S. In reality, some crude oil exported from the Westridge marine terminal is currently sent to costal refineries in the U.S., and Canadian crude oil is sometimes re-exported from the U.S. Gulf Coast. Appendix 4 describes the assumptions in Figure S.8 in more detail, specifically the assumptions underpinning the allocation of capacity to different markets.
Text Alternative: This chart shows illustrative export capacity from pipelines and structural rail compared with total crude oil supply available for export from western Canada from 2010 to 2050 across all scenarios. It displays stacked areas representing export capacity to the Canadian, U.S. and global markets, alongside lines showing total supply available for export under the Lower, Current Measures, Higher, and Canada Net-zero scenarios. Over time, export capacity increases and then remains relatively stable, while total supply available for export follows different trajectories across scenarios, diverging in later years.
The illustrative comparison in Figure S.8 can provide insight into whether pipeline constraints might affect crude oil production. We do not, however, adjust projected crude oil production or what we assume for western Canadian oil prices based on those potential constraints. For more information, see the “Accounting for producer and investor behaviour in production outlooks” textbox in the Results chapter.
Early in the projection period crude oil available for export in the Higher scenario exceeds the illustrative export capacity, with the gap reaching nearly 700 Mb/d later in the projection period. In Current Measures, volumes fluctuate around the same level as the illustrative capacity early in the projection period before rising above capacity for much of the remainder of the projection period, reaching as high as 178 Mb/d above illustrative capacity by 2039. In Canada Net-zero, crude oil available for export is similar to Current Measures and is slightly higher than capacity until about 2038, at which point it begins to fall below capacity. In the Lower scenario, crude oil available for export is below the illustrative capacity throughout the projection period. It is beyond the scope of this report to estimate the level of spare capacity in the pipeline system that would avoid material price reductions for western Canadian crude oil, whether on an ongoing basis or during events such as pipeline maintenance or market disruptions.
The extent to which Canada diversifies its crude oil trade will likely depend on a number of factors, including the destination and amount of any new pipeline capacity, the trajectory of future Canadian crude oil production, how existing flows of crude oil change over time, and future global trade policy shifts.
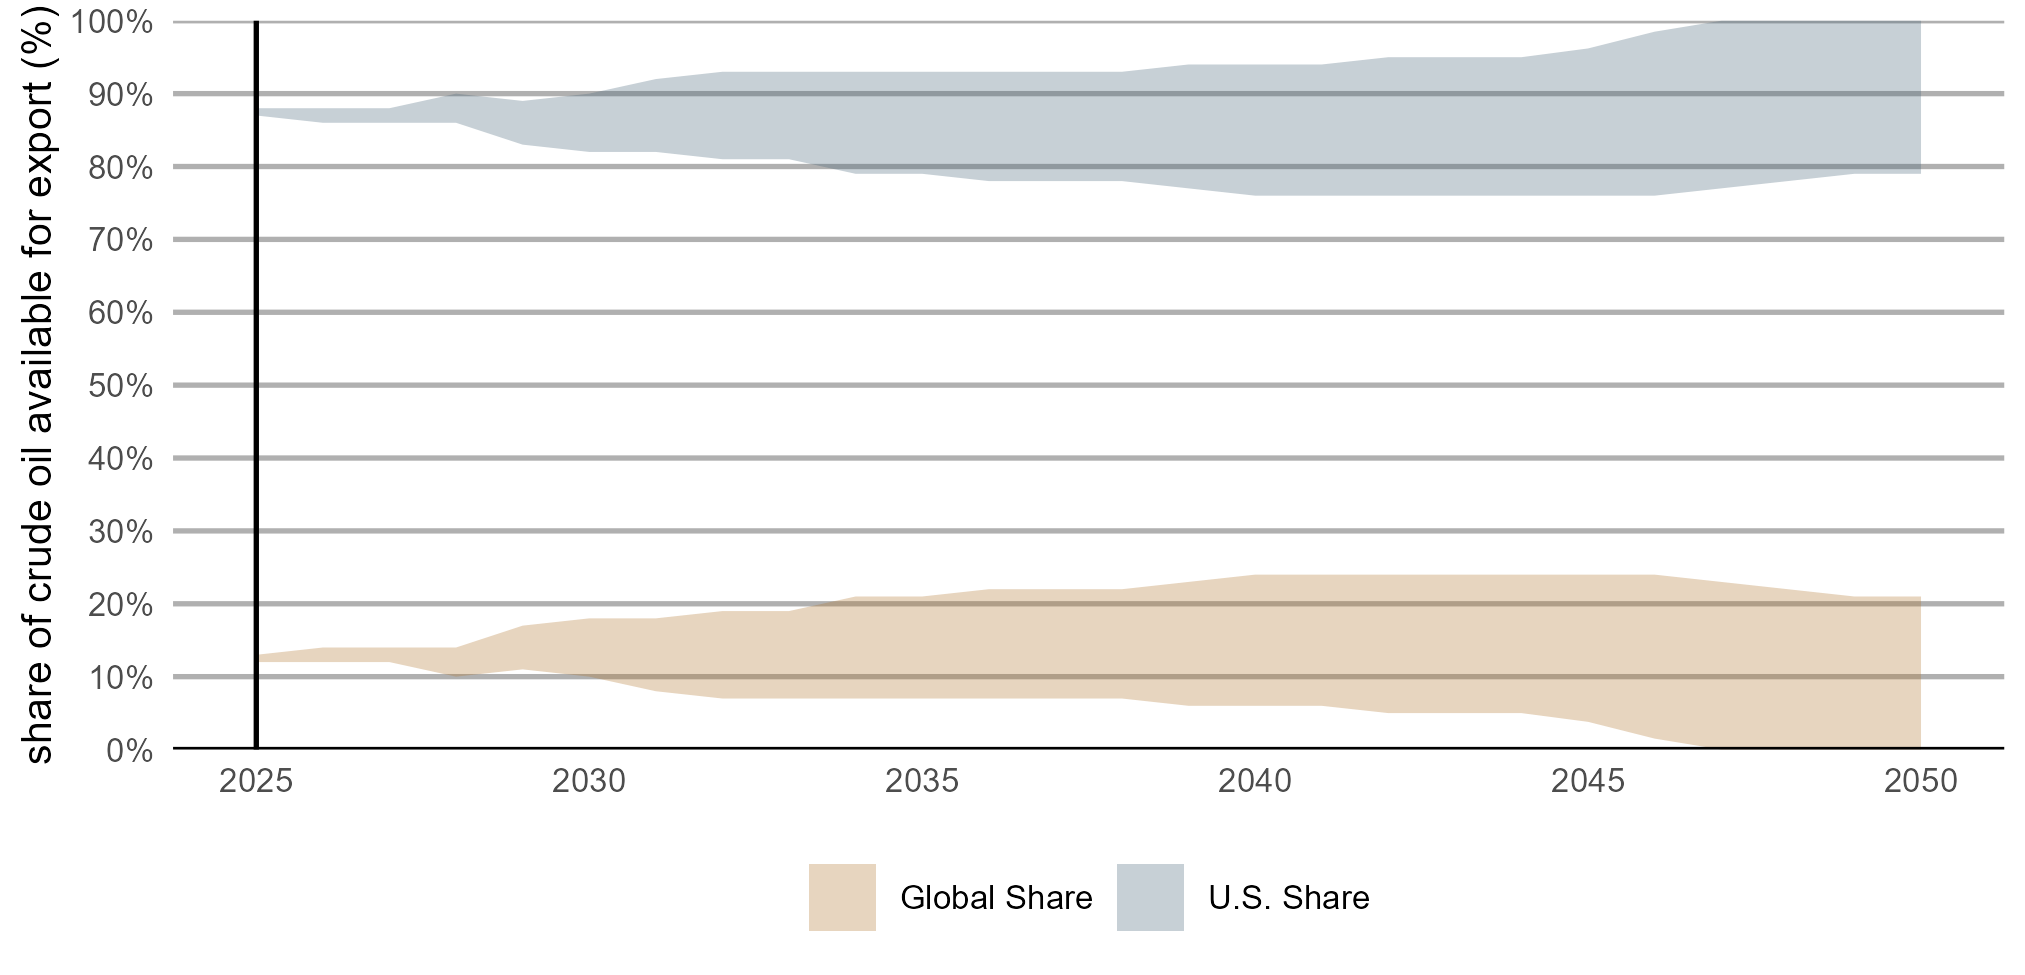
Figure S.9 builds on the illustrative comparison in Figure S.8 to explore implications for Canada’s future crude oil trade diversification. Figure S.9 shows how the market share for Canadian crude oil exports—that is destined for the U.S. versus other global markets—could potentially change under the different oil production projections in our four scenarios. These shares are entirely illustrative—they aim to provide an isolated illustration of the minimum and maximum market shares that might result due specifically to crude oil production changes.
The shares in Figure S.9 are not meant to reflect likely outcomes. Nor are they the result of analyzing the drivers of pipeline flows such as transportation costs or contracts, downstream demand, and potential bottlenecks. Accordingly, the market share ranges in Figure S.9 are meant to provide an analytical starting point for considering future trade diversification, including if the future looked very different—such as if production were materially higher or lower than in our scenarios, or if major incremental pipeline capacity were added to a particular market. This analysis creates these potential ranges using the following methodology:
Text Alternative: This chart shows the range of potential market share for western Canadian crude oil available for export. It shows the range for Global and U.S. markets as wedges that both grow from 2025 to 2050. The range representing global markets increases from around 13% in 2025 to a maximum of just below 25% and a minimum of zero. The U.S. range expands from around 88% in 2025 to a maximum of 100% and a minimum of 76%.
As shown in Figure S.9, there is a relatively narrow range in potential future market shares for the global and U.S. market under the assumptions of this analysis, and the U.S. continues to be the main market for Canadian crude oil exports. This is because so much Canadian crude oil transportation infrastructure is already destined for the U.S. market. Compared to any product or commodity widely shipped using more flexible methods like train, truck, or marine vessel, it is more challenging to shift Canadian crude oil exports to new markets due to the long-lived and fixed route nature of pipeline infrastructure.
In this illustrative analysis, the highest export market diversification occurs in the Higher scenario, when all the crude oil available for export over and above the illustrative pipeline capacity is assumed to go entirely to the global market. In this case, the share of western Canadian crude oil available for export with access to global markets grows from around 13% in 2025 to up to 25% later in the projection period.
The actual level of export market diversification of western Canadian crude oil could be higher or lower than shown in Figure S.9. Factors influencing actual diversification levels could include:

The vast majority of Canada’s crude oil exports are destined for the U.S., as nearly all crude oil pipelines exiting western Canada deliver only to points in the U.S. The lack of diversity in export markets can make Canadian crude oil producers and the Canadian economy more vulnerable to disruptions.
While the comparison of export capacity to the volume of crude oil available for export from western Canada depicted in this section does not indicate the extent to which any existing or additional pipeline capacity would be utilized or not, it highlights a substantial range of potential outcomes. For example, in the Higher scenario, crude oil available for export exceeds available capacity, while in the Lower scenario it is lower than capacity throughout the projection period.
The analysis also indicates that with oil production as projected in our scenarios, there is somewhat limited potential to diversify Canada’s crude oil trade. Diversification could be higher if crude oil production ends up being higher than in the scenarios in this report, which would lead to an increase in crude oil available for export and the potential to reach global markets. Greater diversification could also be realized if crude oil pipeline capacity to access global markets was expanded such that overall capacity is well above crude oil available for export in our scenarios, and that additional capacity draws volumes away from the U.S. market.