Canada’s Energy Future 2026: Energy Supply and Demand Projections to 2050 is the latest long-term energy outlook from the Canada Energy Regulator (CER). The Canada’s Energy Future series explores how possible energy futures might unfold for Canadians over the long term, building on decades of economic and energy modelling and analysis. Our scenarios cover all energy commodities and all Canadian provinces and territories.
This scenario analysis explores future uncertainties facing the energy system. Relying on just one scenario to understand the energy outlook implies too much certainty about what could happen in the future. The results in this report are not predictions about the future nor policy recommendations. Rather, they are the product of modeled scenarios based on a specific set of assumptions—and these assumptions are outlined transparently in the report or its appendices.
This report includes four scenarios to explore Canada’s energy outlook. One of these is Current Measures, a traditional baseline scenario. To explore uncertainty in energy and economic drivers, we introduce two new symmetrical scenarios that bracket the Current Measures scenario: the Higher scenario and Lower scenario. These scenarios examine outcomes if key drivers of Canada’s energy system—specifically, Canadian gross domestic product (GDP) growth, liquefied natural gas (LNG) exports, data centre electricity demand, and global oil and natural gas prices—trend higher or lower than in Current Measures. Together, they define a range of outcomes driven by factors not directly tied to a specific future goal or policy outcome. We do not assign probabilities to any of our scenarios.
We also updated the Canada Net-zero scenario, first introduced in Canada’s Energy Future 2023. Compared to the first three scenarios, which do not have a pre-determined end point, the Canada Net-zero scenario begins with a predetermined end point of net-zero greenhouse gas (GHG) emissions for Canada by 2050—exploring what a pathway to that end point could look like. It assumes the rest of the world also increases the pace of climate action, leading to lower global oil and natural gas demand than Current Measures (hence lower oil and natural gas prices) and lower clean technology costs, due to increasing technological development in Canada and abroad.
To explore key issues related to energy security and trade diversification, the report includes a section that examines what the projections imply for three aspects of Canada’s energy system: the energy self-sufficiency of Central Canada (with a focus on Ontario and Quebec, given their reliance on energy arriving from the U.S.), the resiliency of the supply chain needed to expand Canada’s electricity system, and the potential for diversifying western Canada’s crude oil exports.
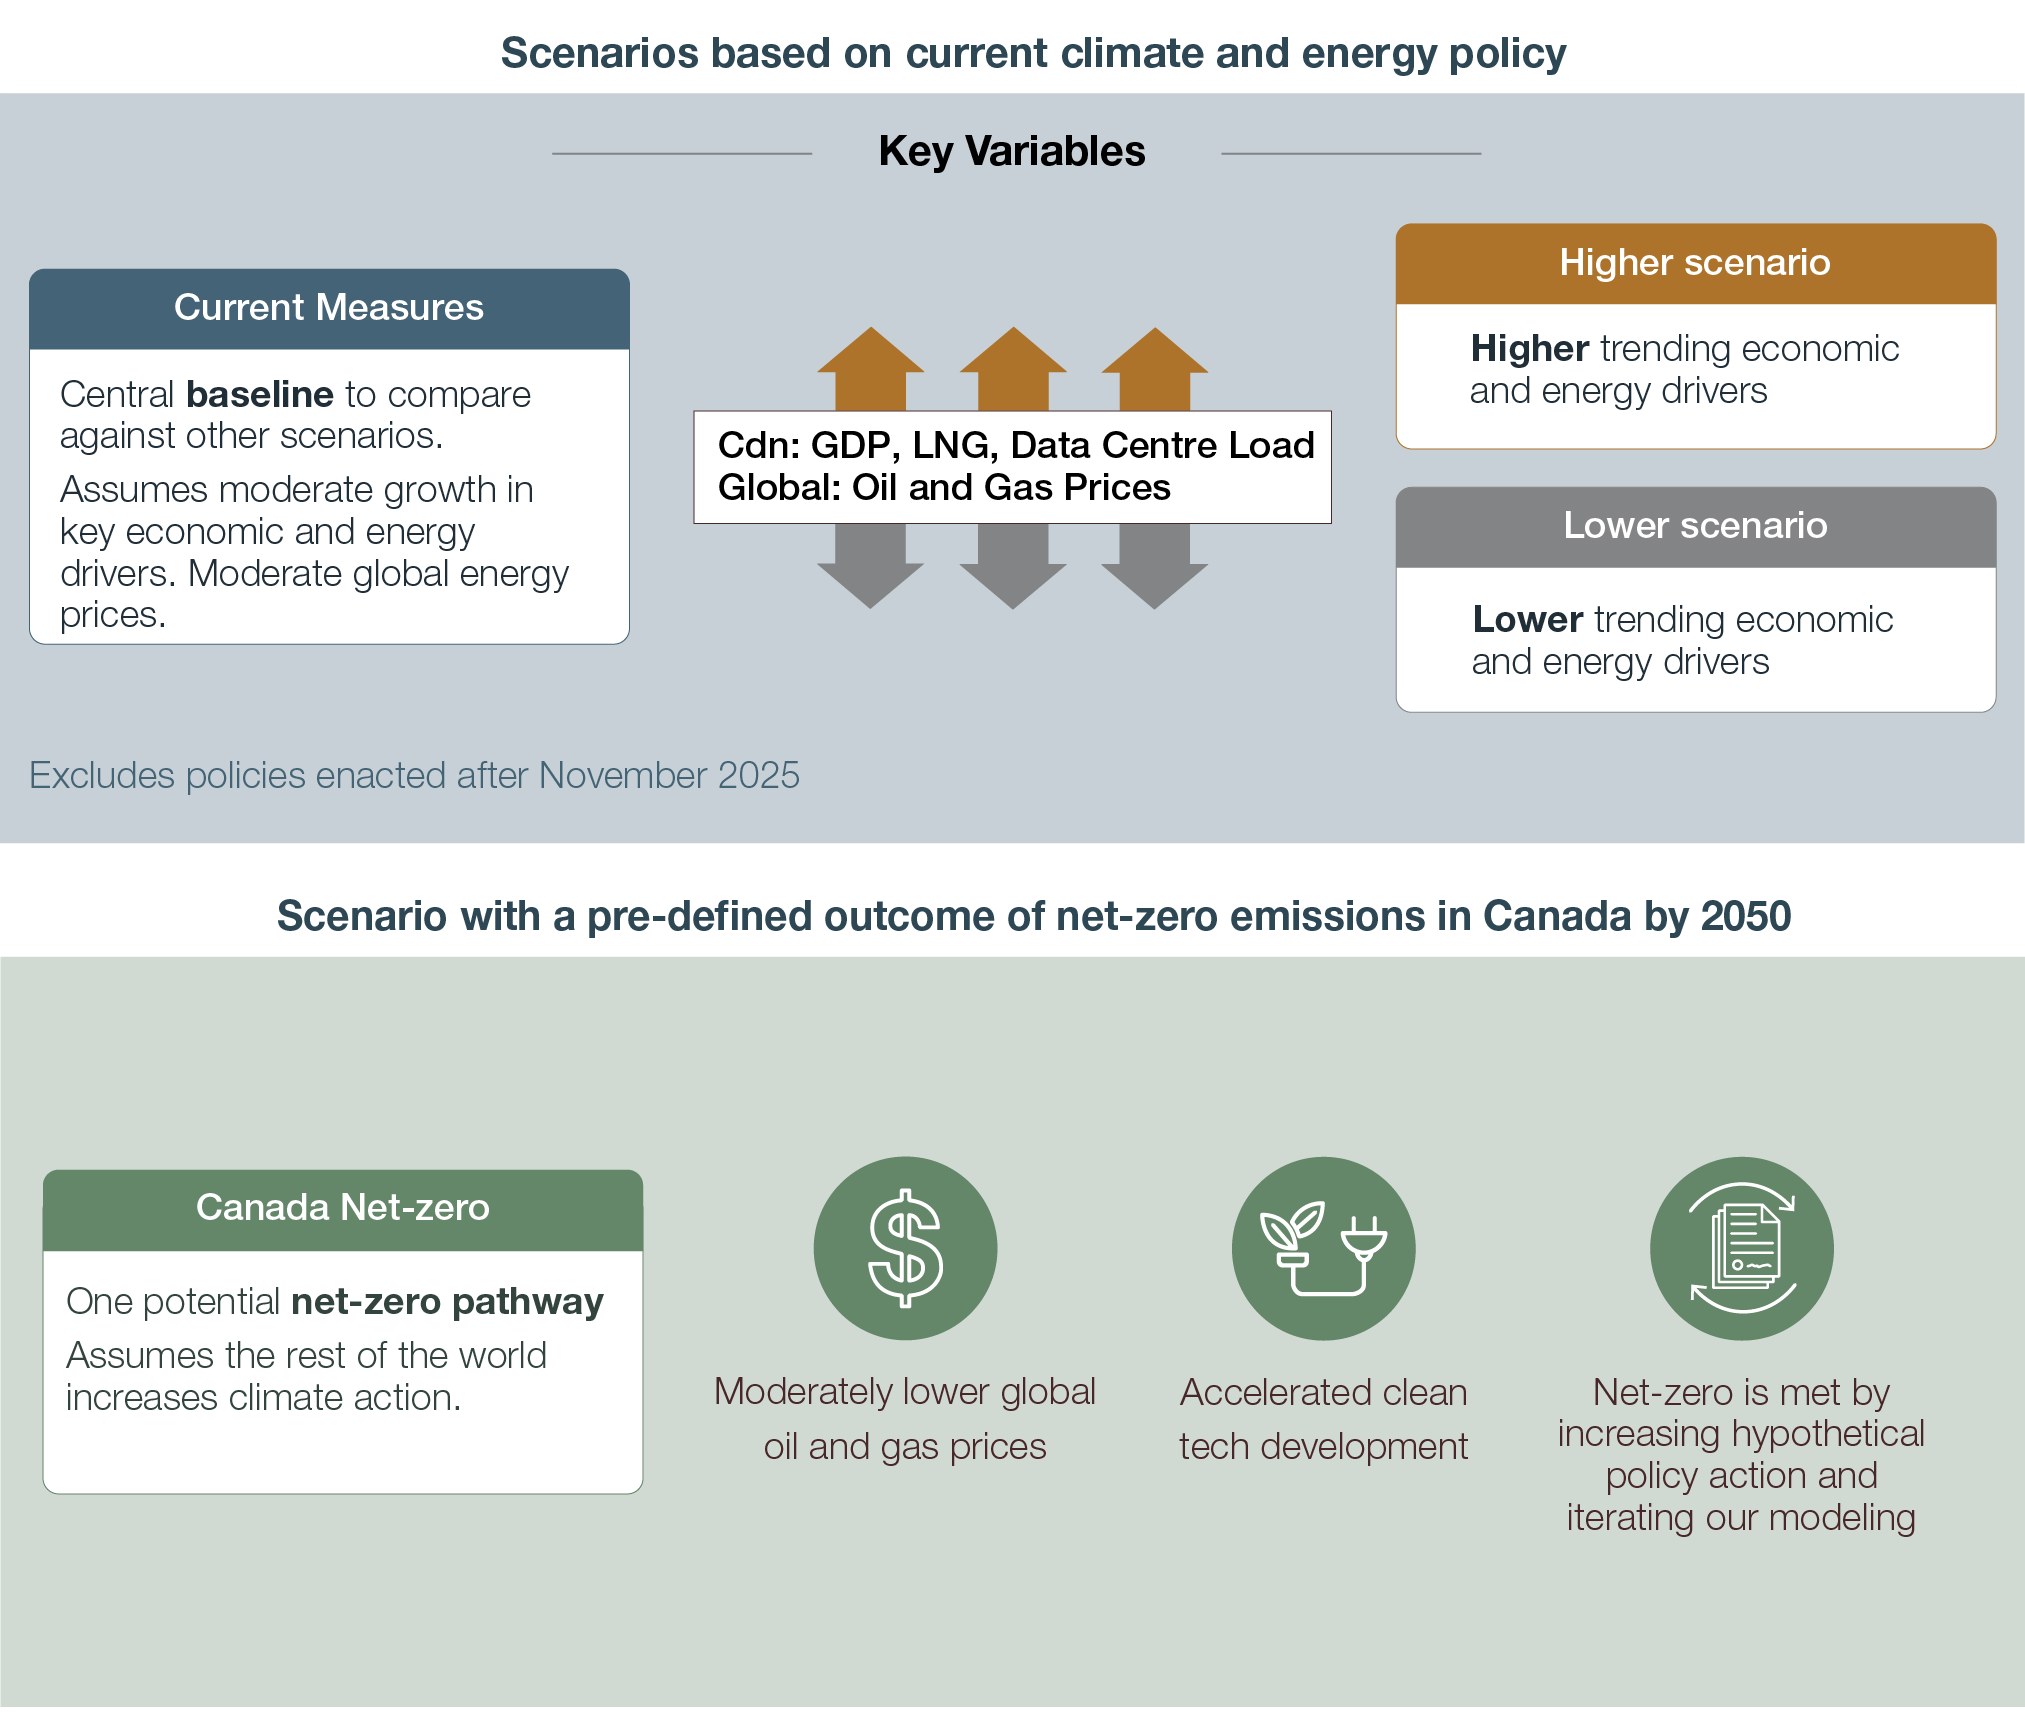
Text Alternative: This figure illustrates the scenarios in Canada’s Energy Future 2026, and how they relate to each other. It describes Current Measures and shows how the Higher and Lower scenarios change a few key assumptions from Current Measures. It also shows that the Canada Net-zero scenario as a potential pathway, with net-zero by 2050 as a pre-defined outcome.
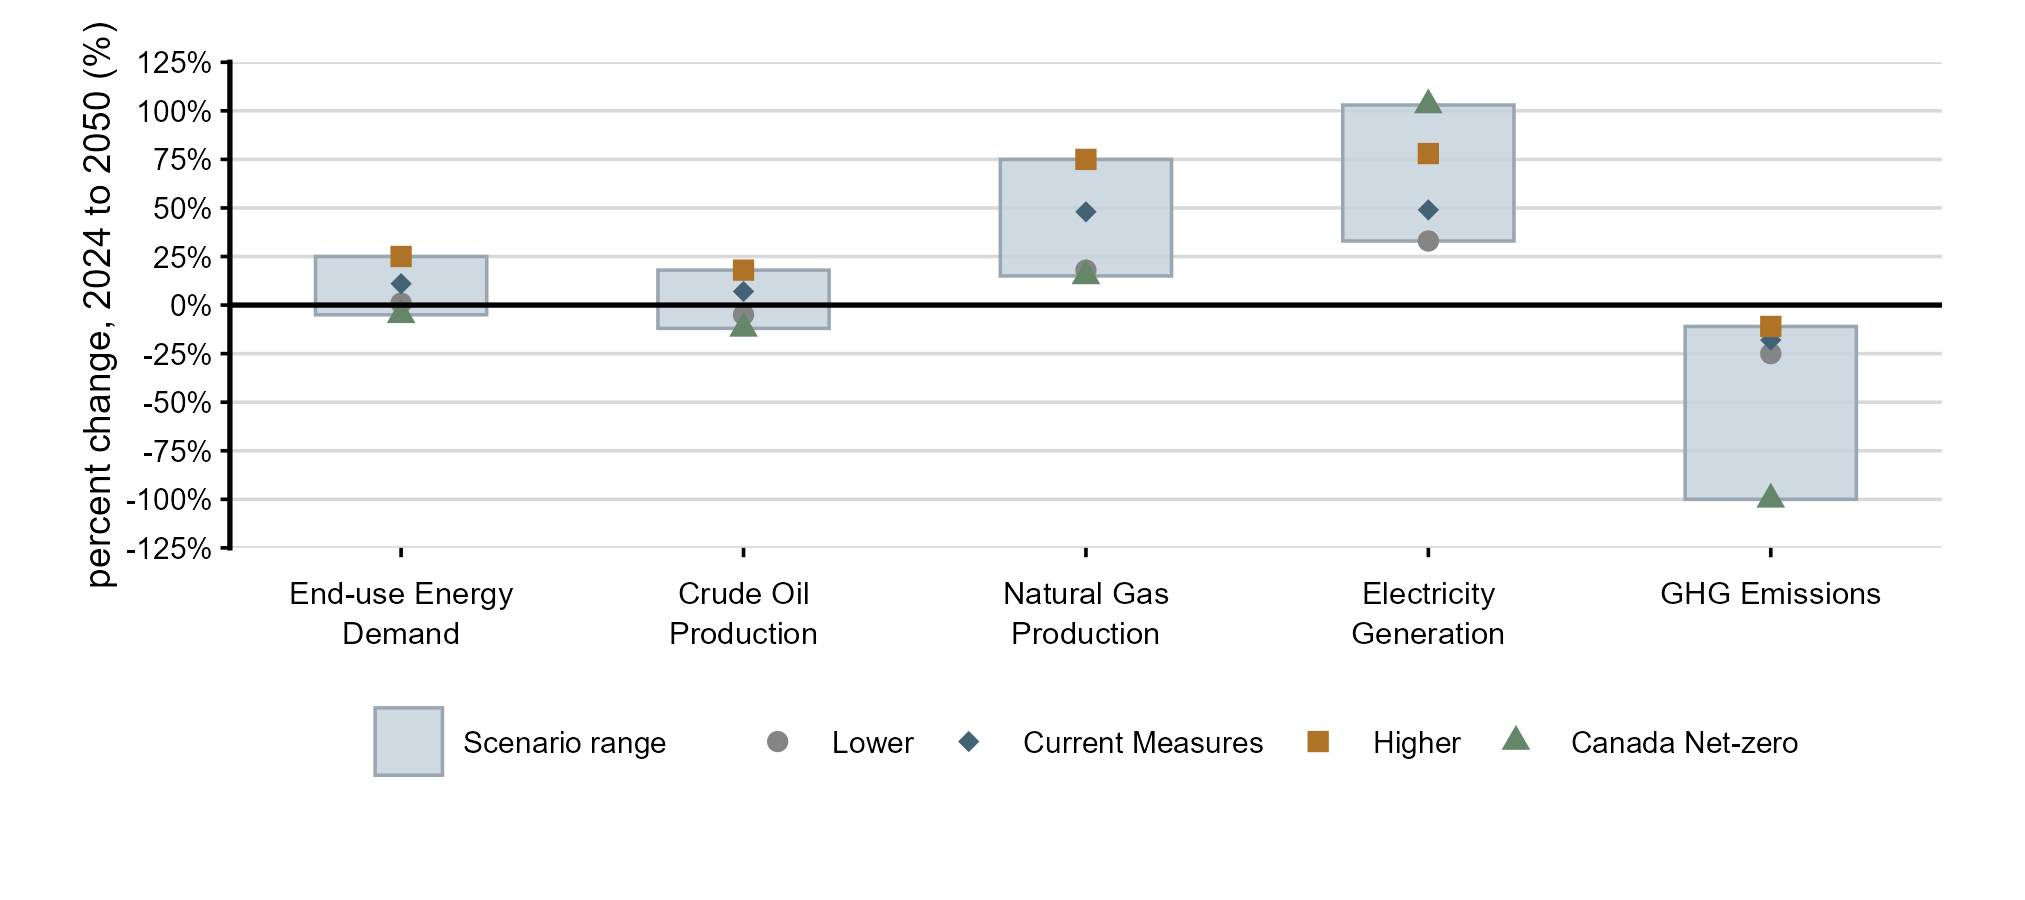
Our scenarios provide a range of outcomes for Canadian energy supply, demand, and GHG emissions, some of which are shown in Figure ES.2. Overall, our scenarios show that the assumptions we change across the scenarios—such as economic growth, energy prices, and level of climate action—have an impact on future energy system trends.
Description: This figure shows the percentage change from 2024 to 2050 in end-use energy demand, crude oil production, natural gas production, electricity generation, and GHG emissions across the four scenarios. For each indicator, the figure shows both the range of outcomes across scenarios and the individual scenario values. The range varies by indicator, with relatively narrow ranges for end-use energy demand and crude oil production, wider ranges for natural gas production and electricity generation, and the widest range for GHG emissions.

In some cases, there are wide projected ranges shown in Figure ES.2. The future is uncertain, and the ranges are not intended to capture every possibility. It is plausible that actual trends could be outside these ranges. Some important societal or economic trends that are not included in our modelling could further influence Canada’s energy future, including:
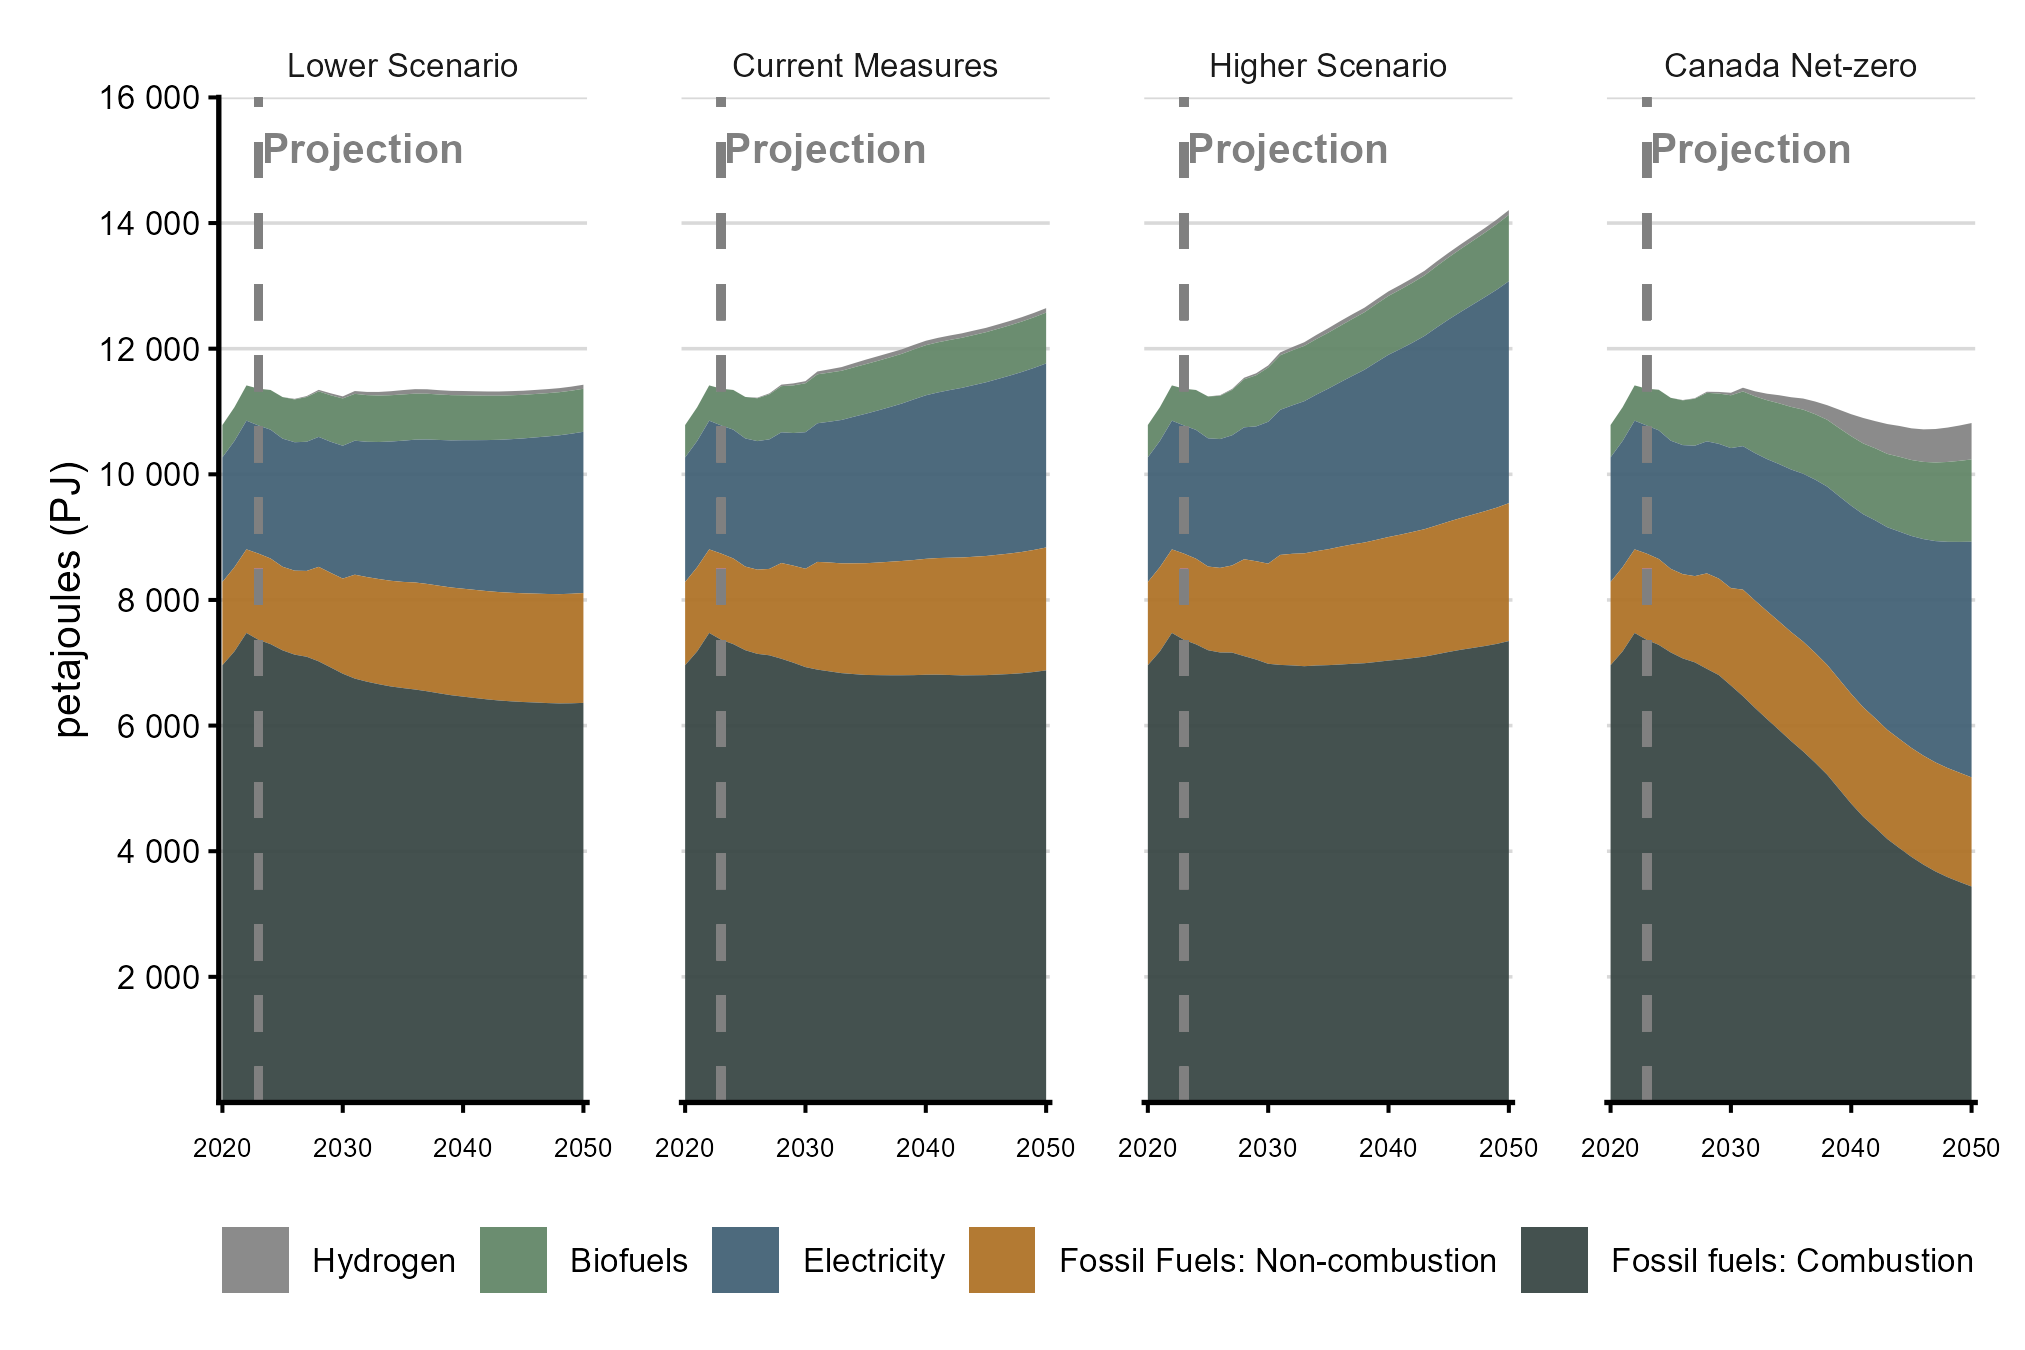
By 2050, Canada’s total energy use varies widely across scenarios—from 5% below today’s levels to 25% above. Electricity demand grows substantially in every case, while hydrocarbon use remains relatively stable except in the Canada Net Zero scenario, where it drops by 40%.
Canada’s end-use demand grows by 11% from 2023 to 2050 in Current Measures, whereas the Higher and Lower scenarios have around 10% more or less demand than Current Measures in 2050 (Figure ES.3). In Canada Net-zero, end-use demand is 5% lower than 2023 in 2050. Electricity demandFootnote 1 grows significantly in all scenarios, ranging between a 26% to 85% increase from 2023 to 2050, and growth comes from a wide variety of end-uses. All scenarios include increasing adoption of passenger electric vehicles (EVs) (in part due to all scenarios including the federal standard that requires 100% of vehicle sales in 2035 to be zero-emission vehiclesFootnote 2), and demand from new data centres. The additional electricity demand in the Higher scenario is driven by assumptions related to greater data centre load growth, and higher assumed economic growth. In the Current Measures, Higher, and Lower scenarios, fossil fuel demand is relatively stable, with the share being used for non-combustion purposes, like petrochemical feedstocks, lubricants, and asphalt rising from 15% currently, to 20-25% by 2050.
Canada Net-zero sees the most change in Canadian energy demand. Electricity demand is highest among the four scenarios, reflecting greater electrification across the economy. By 2050, electricity is the largest energy type in the mix, accounting for nearly 35% of total demand, compared to 23% in Current Measures and 18% today. Fossil fuel demand declines by 40% but still plays a relatively large role. By 2050, about one-third of fossil fuel demand is for non-combustion purposes, given steeply falling use of combusted fossil fuels.
Text Alternative: This figure shows end-use energy demand by fuel type from 2020 to 2050 for the Lower, Current Measures, Higher, and Canada Net-zero scenarios. Each panel displays stacked areas for fossil fuels used for combustion, fossil fuels used for non-combustion purposes, electricity, biofuels, and hydrogen. Across all scenarios, total end-use demand evolves over time, with the relative contribution of fuel types changing, most notably a declining share of fossil fuels for combustion and a growing contribution from electricity in later years.
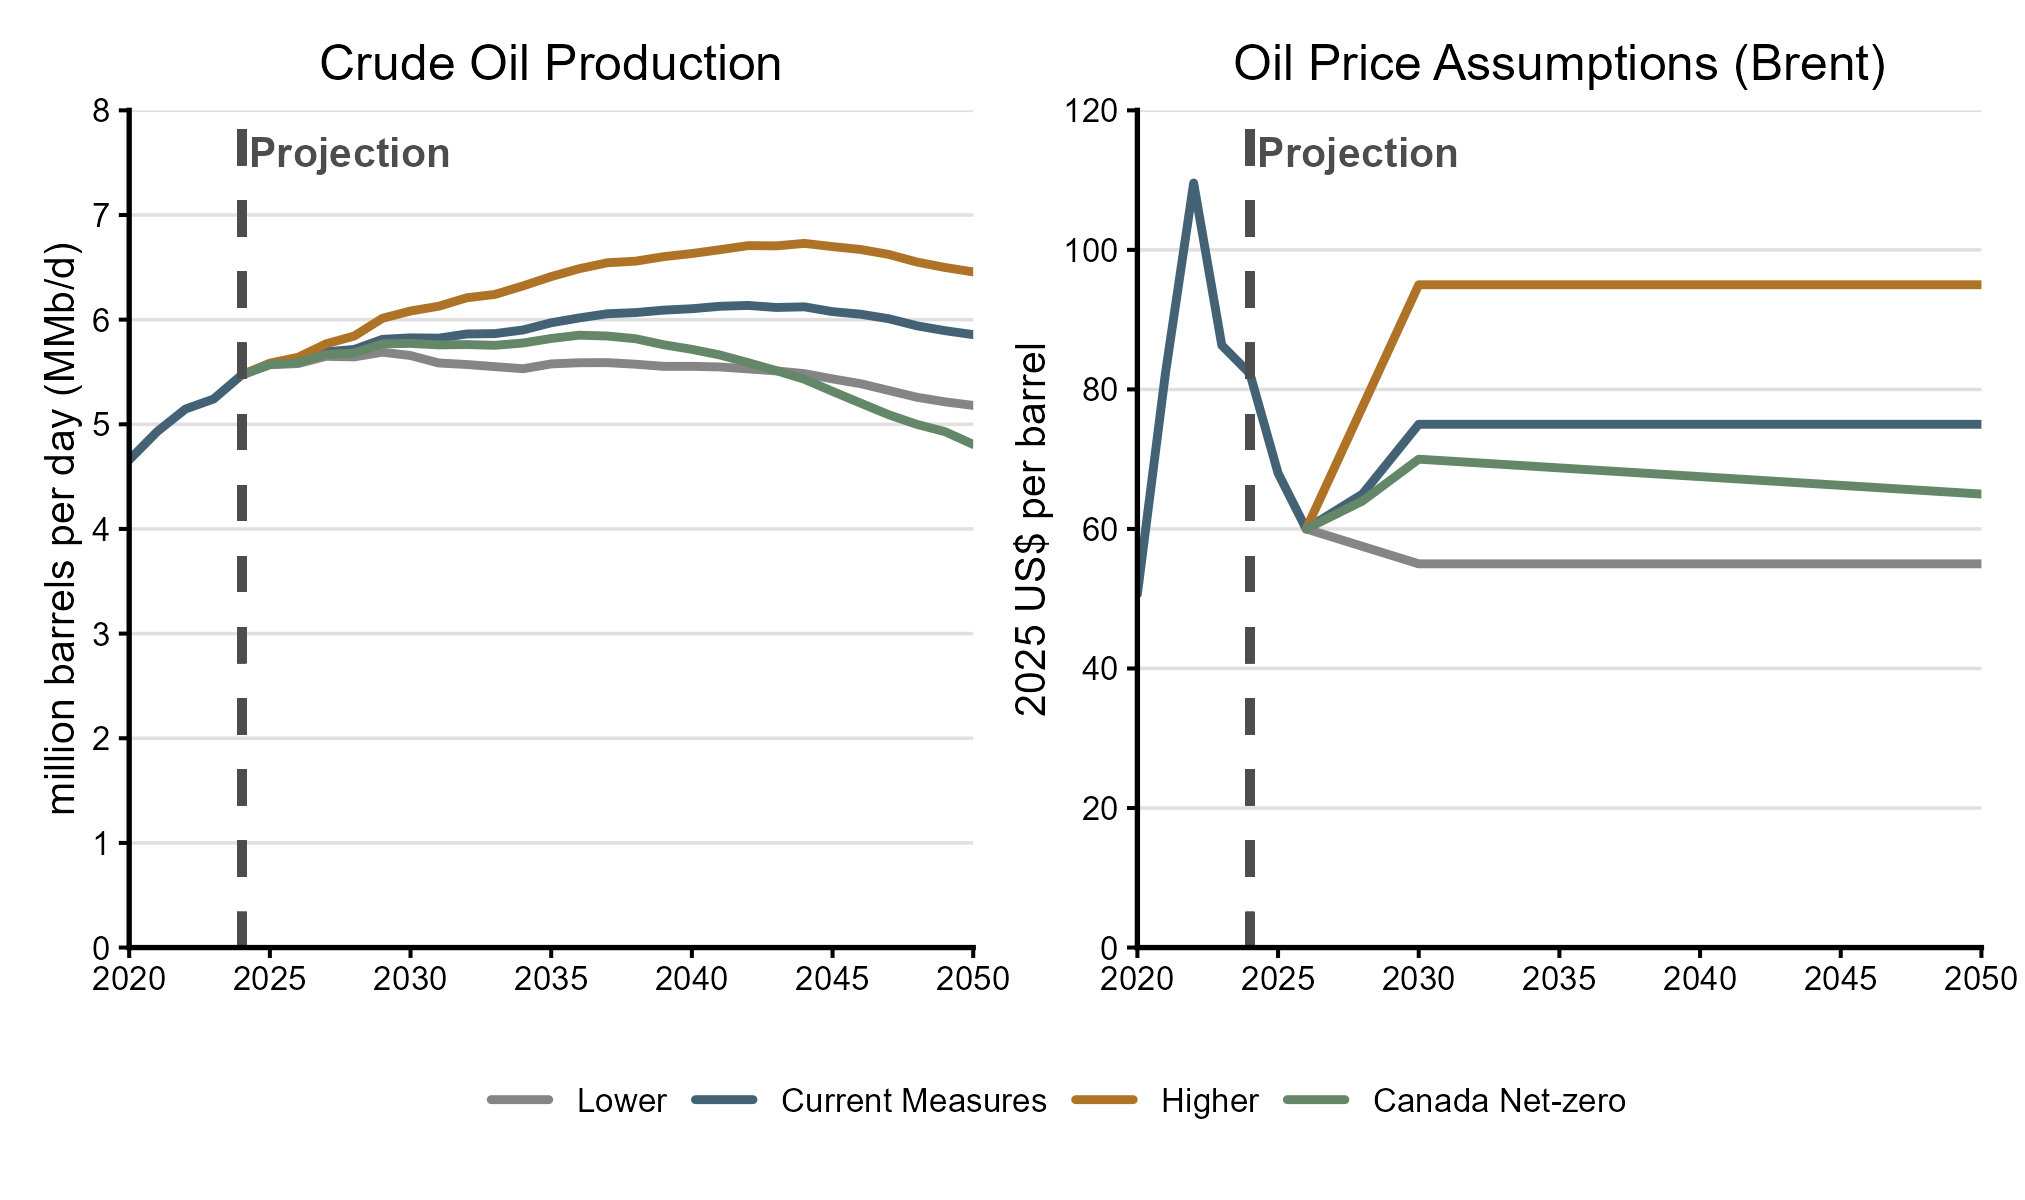
Depending on the scenario, crude oil production ranges from modest decline to solid growth by 2050 (–12% to +18%). Global oil prices are the key driver of production long term but many other factors, including future investment trends and technology, also play an important role.
In every year since 2021, Canadian crude oil production has hit new highs, with production averaging 5.5 MMb/d in 2024 and growing even further in 2025. Most scenarios show potential for further growth, depending on the underlying assumptions. In our modeling, global oil prices are key drivers of production trends (Figure ES.4). As prices rise, there is a greater incentive for producers to increase production. Led by growth in the oil sands, total oil production peaks at 6.1 million barrels per day (MMb/d) in Current Measures by 2042 and 6.7 MMb/d in the Higher scenario in 2044. Production peaks at 5.7 MMb/d in 2029 in the Lower scenario, and 5.9 MMb/d in 2036 in Canada Net-zero, before gradually declining.
By 2050, Canadian crude oil production is between 4.8 and 6.5 MMb/d across the scenarios. This range is large—1.7 MMb/d, or 30% of current production. Producer capital allocation, and producer expectations on factors such as available pipeline capacity, commodity prices, and policies, will influence future investment levels. Our projections are premised on producers continuing to behave as they have in recent years. Should producer behaviour change in the future, production growth could be meaningfully higher or lower than the scenarios in this report project, even under similar price assumptions.
Text Alternative: This figure shows total crude oil production and global oil price assumptions from 2020 to 2050 across all scenarios. The left panel presents crude oil production by scenario, measured in million barrels per day. The right panel shows the corresponding global oil price assumptions, expressed in 2025 US$ per barrel, with distinct price paths for the Lower, Current Measures, Higher, and Canada Net-zero scenarios.
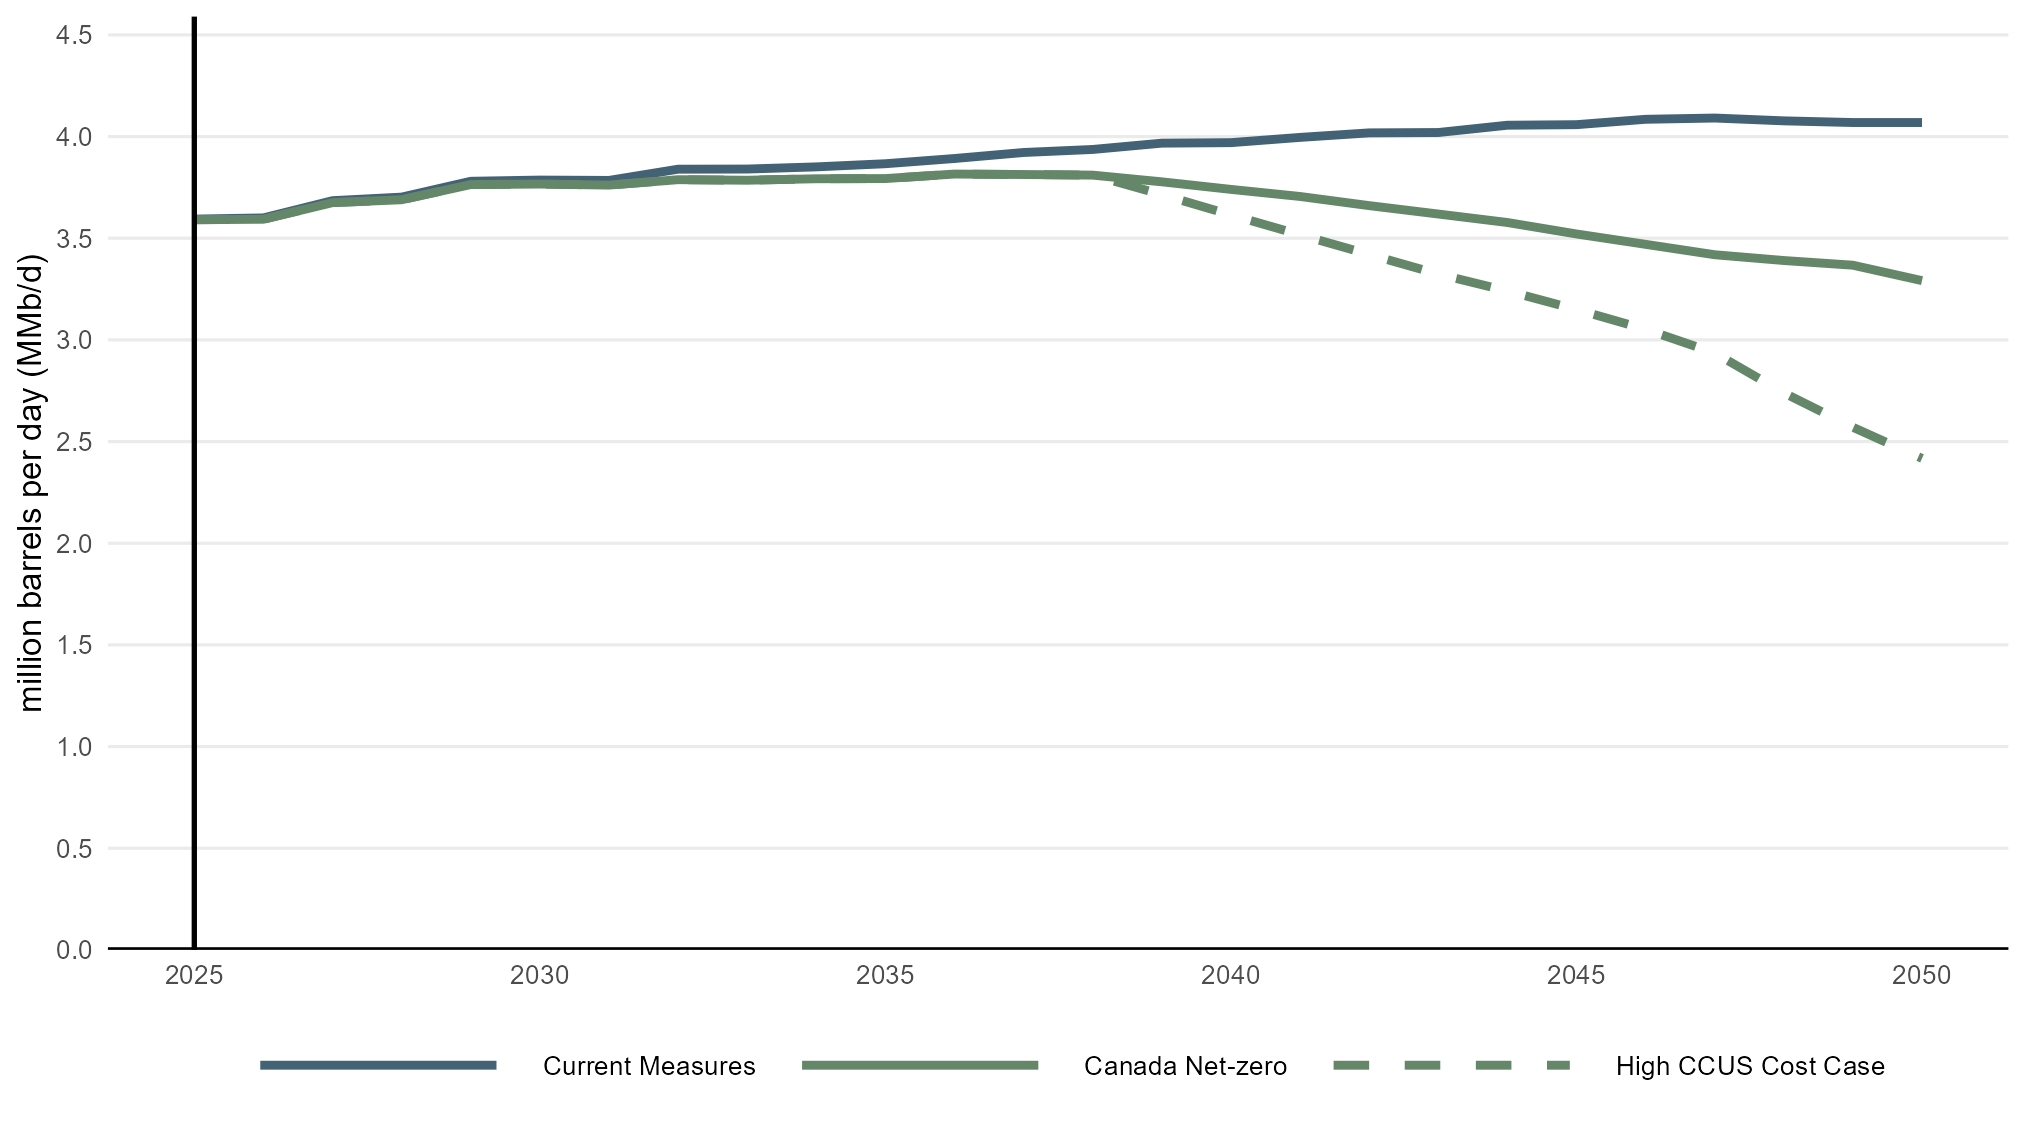
In Canada Net-zero, we assume global oil prices are moderately lower than Current Measures, contributing to limited growth and eventually declining production to around 5 MMb/d by 2050. Producers are also significantly reducing their emissions in this scenario by building carbon capture, utilization, and storage (CCUS) capacity. Our CCUS cost assumptions play an important role in how much of the technology is adopted in our scenarios. CCUS remains an emerging technology with highly uncertain future costs. To explore this uncertainty, we developed a High CCUS Cost sensitivity case. This sensitivity case starts with the same assumptions as Canada Net-zero but uses CCUS costs for oil sands operations that are about double those used in Canada Net-zero. Faced with higher CCUS costs, oil sands producers increasingly choose to shut down production instead of applying more costly CCUS or other, more expensive decarbonization options. In the High CCUS Cost sensitivity case, oil sands production trends 27% lower than Canada Net-zero by 2050 (Figure ES.5), highlighting how significantly future production could vary in this sort of scenario.
Text Alternative: This figure shows oil sands production from 2025 to 2050 in Current Measures, Canada Net-zero, and the High CCUS Cost sensitivity case. Production is shown in million barrels per day (MMb/d). Oil sands production increases gradually over time in the Current Measures scenario, while it declines in the Canada Net-zero scenario after the mid-2030s. The High CCUS Cost sensitivity case shows a steeper decline in production relative to Canada Net-zero in later years.
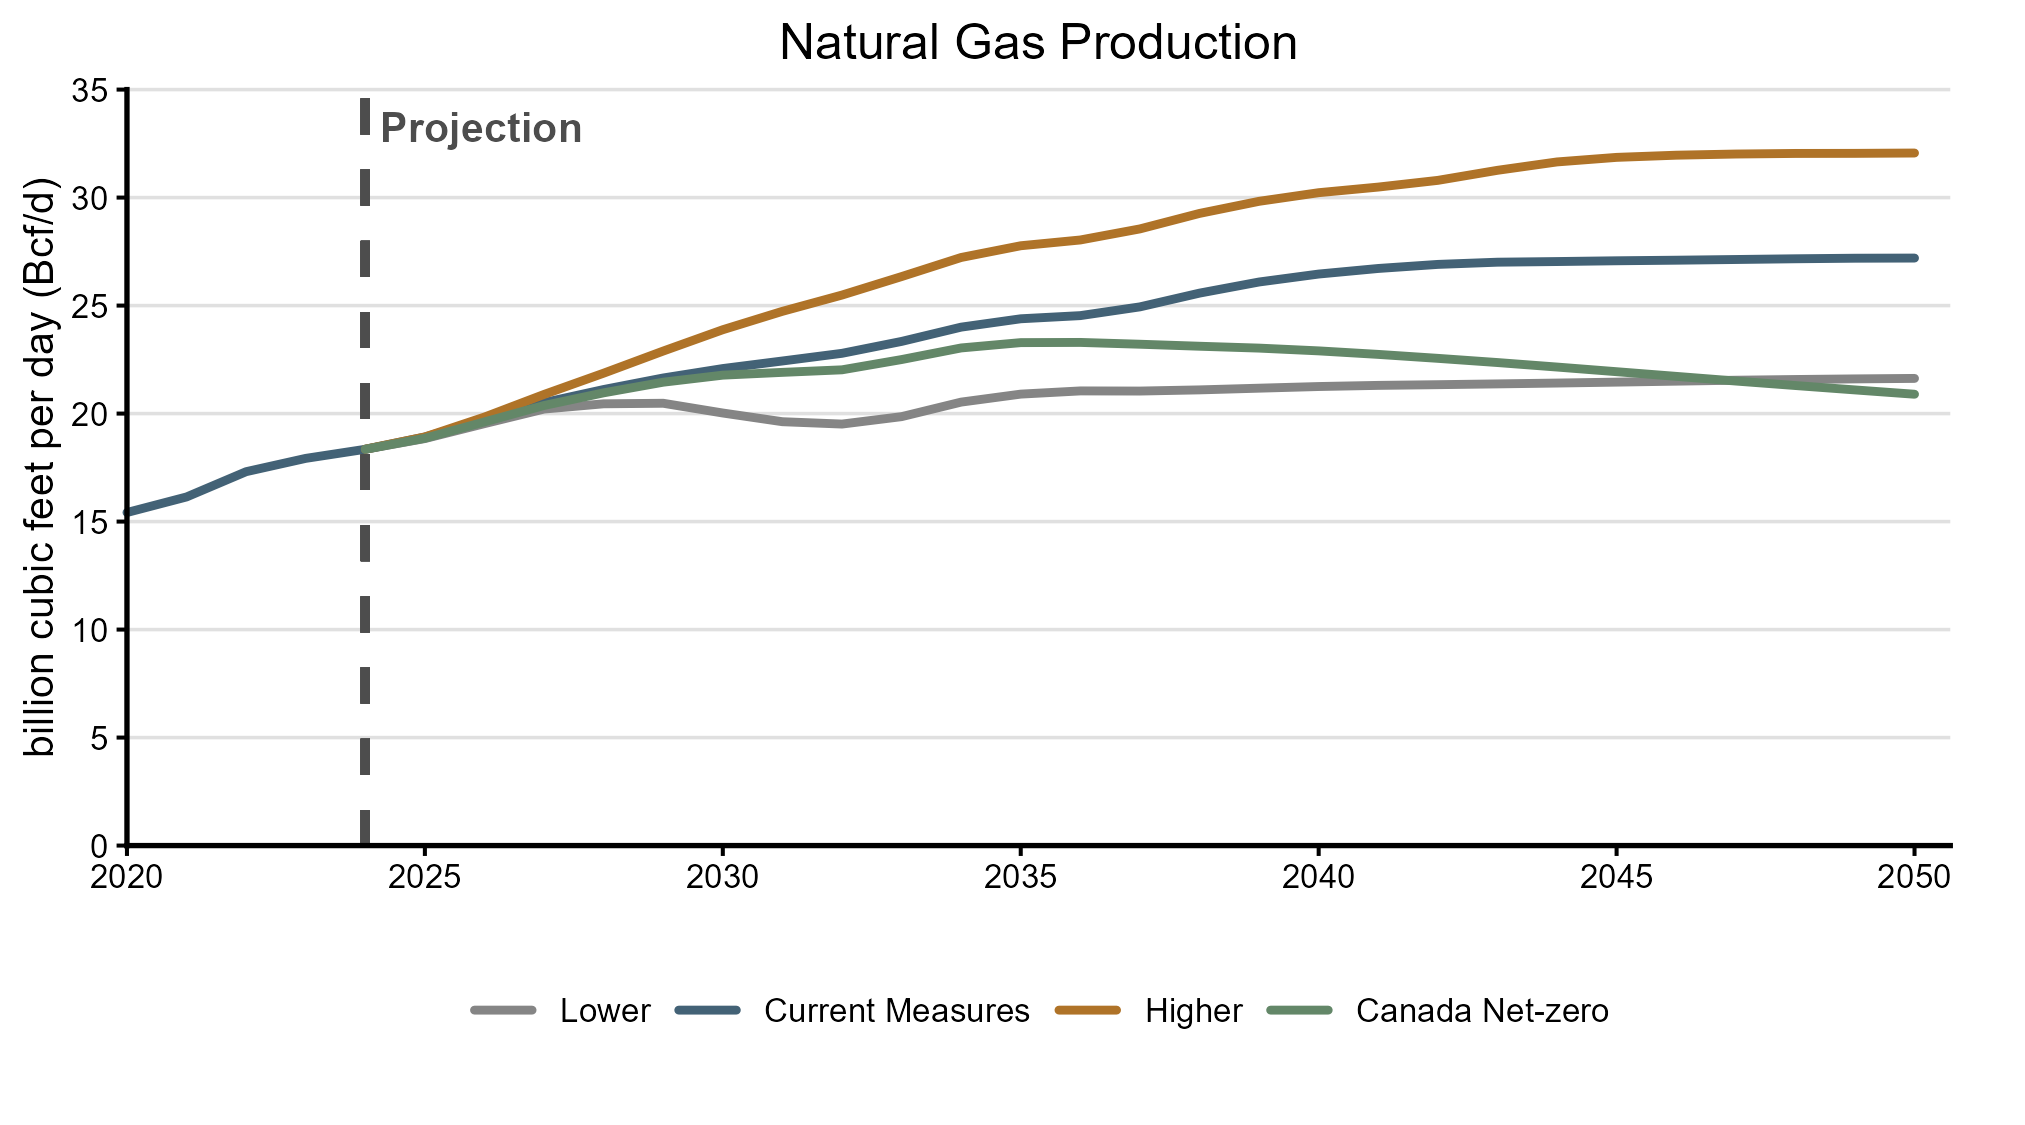
Natural gas production grows in all scenarios, ranging between 21 Bcf/d and 32 Bcf/d in 2050. Natural gas prices and assumed LNG export volumes drive these trends.
Like crude oil, natural gas production hit record highs in 2024, reaching 18.3 billion cubic feet per day (Bcf/d), and continued to grow in 2025. By 2050, natural gas production reaches 27 Bcf/d in Current Measures, and 32 Bcf/d in the Higher scenario. Canada Net-zero and the Lower scenario converge to around 21 Bcf/d in 2050 (Figure ES.6). Natural gas production growth is largely centered in the Montney area in Northeast British Columbia and Northwest Alberta.
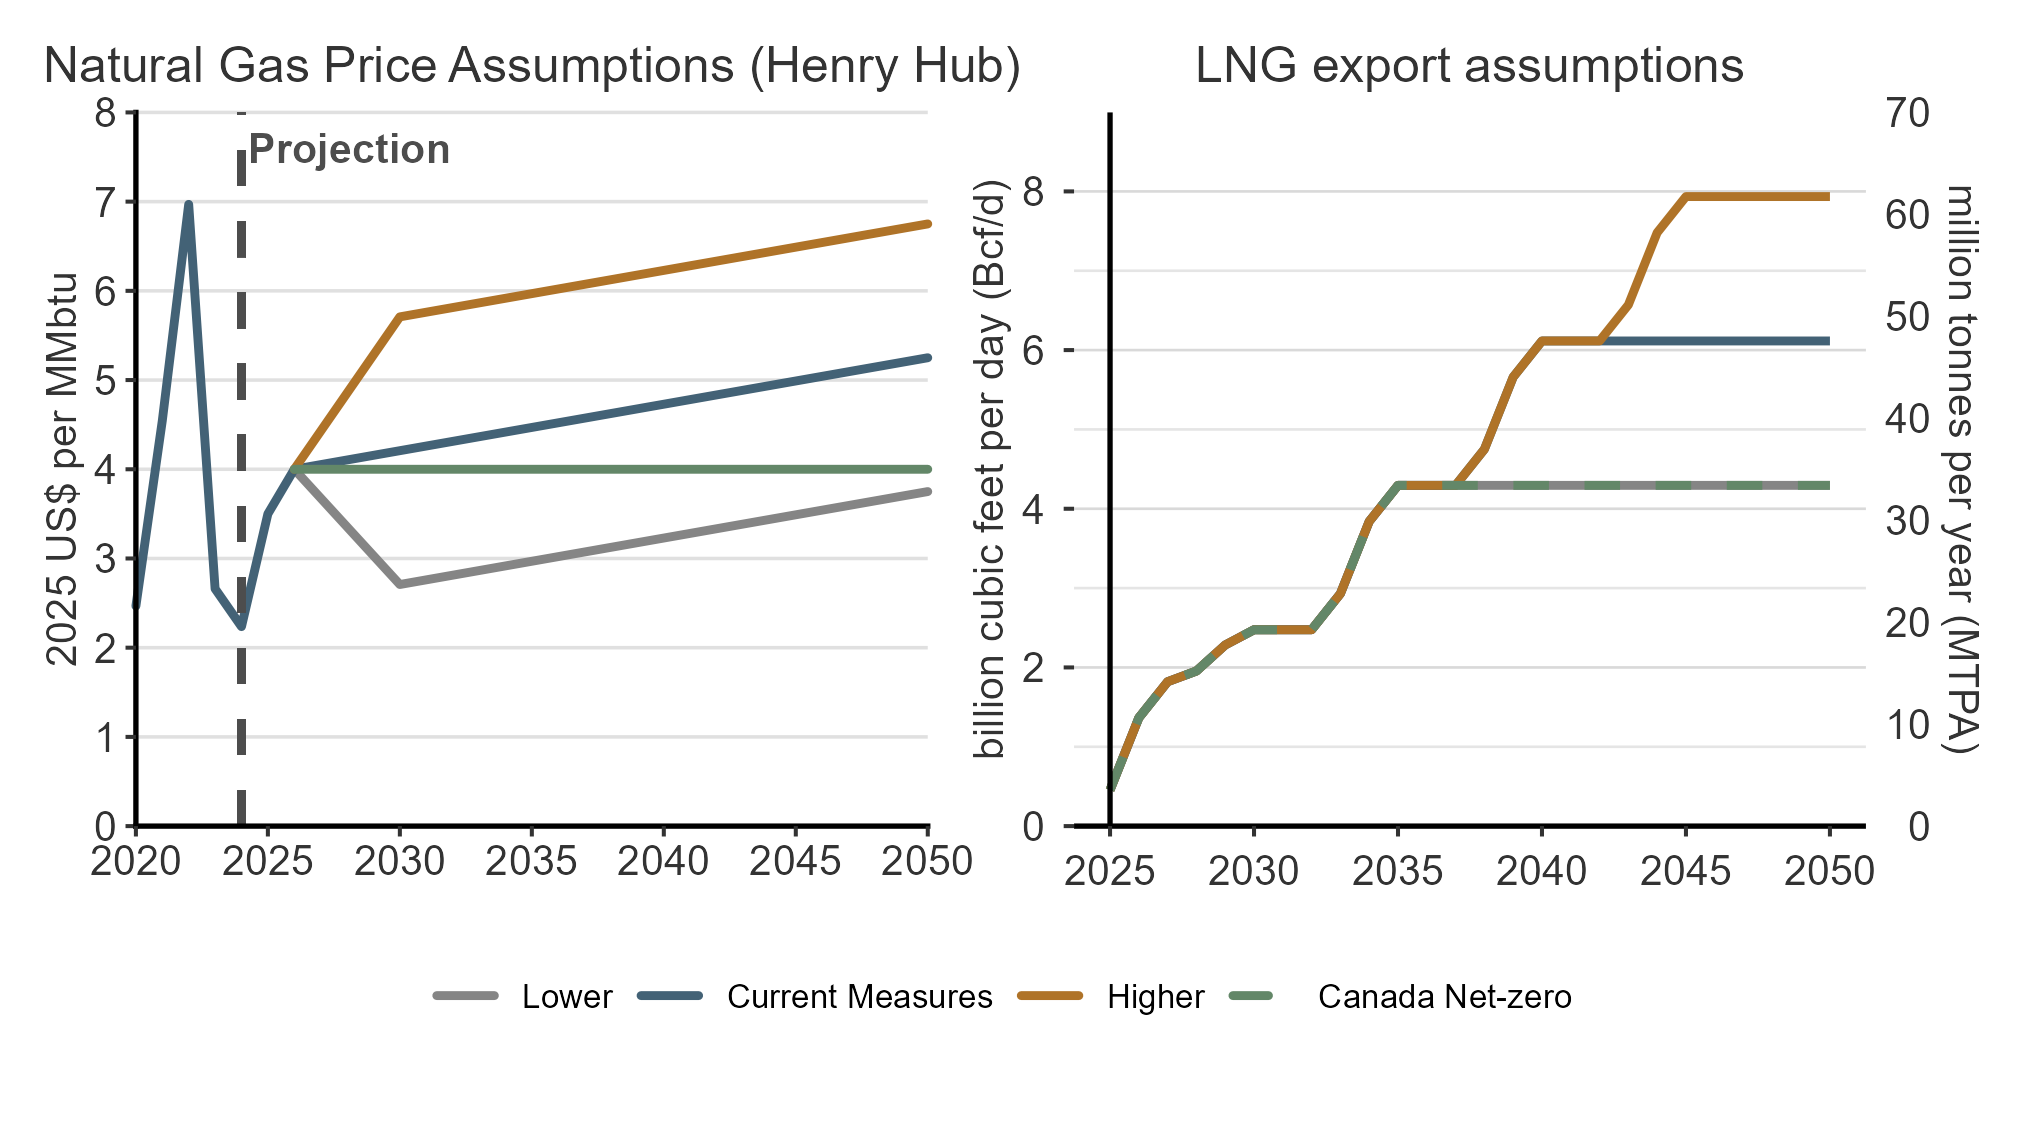
Our assumptions about natural gas prices and future LNG export levels are an important driver of production growth (Figure ES.7). In Current Measures, we assume 6.1 Bcf/d of natural gas goes to LNG by 2050 (48 million tonnes per annum (MTPA)), 7.9 Bcf/d in the Higher scenario (62 MTPA), and 4.3 Bcf/d in the Lower scenario and Canada Net-zero (33 MTPA). In all our scenarios, most incremental natural gas production goes to LNG exports. In 2050, LNG makes up between 20-25% of total production across all scenarios.
Text Alternative: This figure shows total natural gas production from 2020 to 2050 across all scenarios. Production increases gradually from 2020 through the late 2020s, then diverges by scenario. The Higher scenario reaches the highest production level, 32 Bcf/d in 2050. Current Measures show a similar trajectory, but with lower volumes across the projection period. In Canada Net-zero, production reaches 23 Bcf/d in 2036, followed by a modest decline. In the Lower scenario, production peaks in the mid-to-late 2020s, and remains relatively flat for the rest of the projection period.
Text Alternative: This figure includes two line charts. The chart on the left shows assumed international natural gas price (Henry Hub) across scenarios in 2025 US$ per MMBtu. In Current Measures, the natural gas price rises to around $5.25 per MMBtu in 2050. In the Higher scenario it rises rapidly until 2030 and then more steadily, to reach $6.75 in 2050. In the Lower scenario it goes down to around $2.75 per MMBtu by 2030 and then goes up again to almost reach 2026 levels by 2050. In Canada Net-zero, it remains flat at $4.00 per MMBtu across the projection period. The chart on the right shows assumed Canadian LNG export volumes across scenarios. Exports increase gradually starting in 2025 as initial projects come online. In the Lower scenario, volumes reach 4.25 Bcf/d in 2035 and remain flat for the rest of the projection period. Current Measures follows the same path and then rises to 6 Bcf/d by 2040. The Higher scenario follows the same path as Current Measures until 2035, after which there is additional growth leading to 8 Bcf/d by 2045. In Canada Net-zero levels are the same as the Lower scenario. Export volumes remain constant after reaching their peak in each scenario.
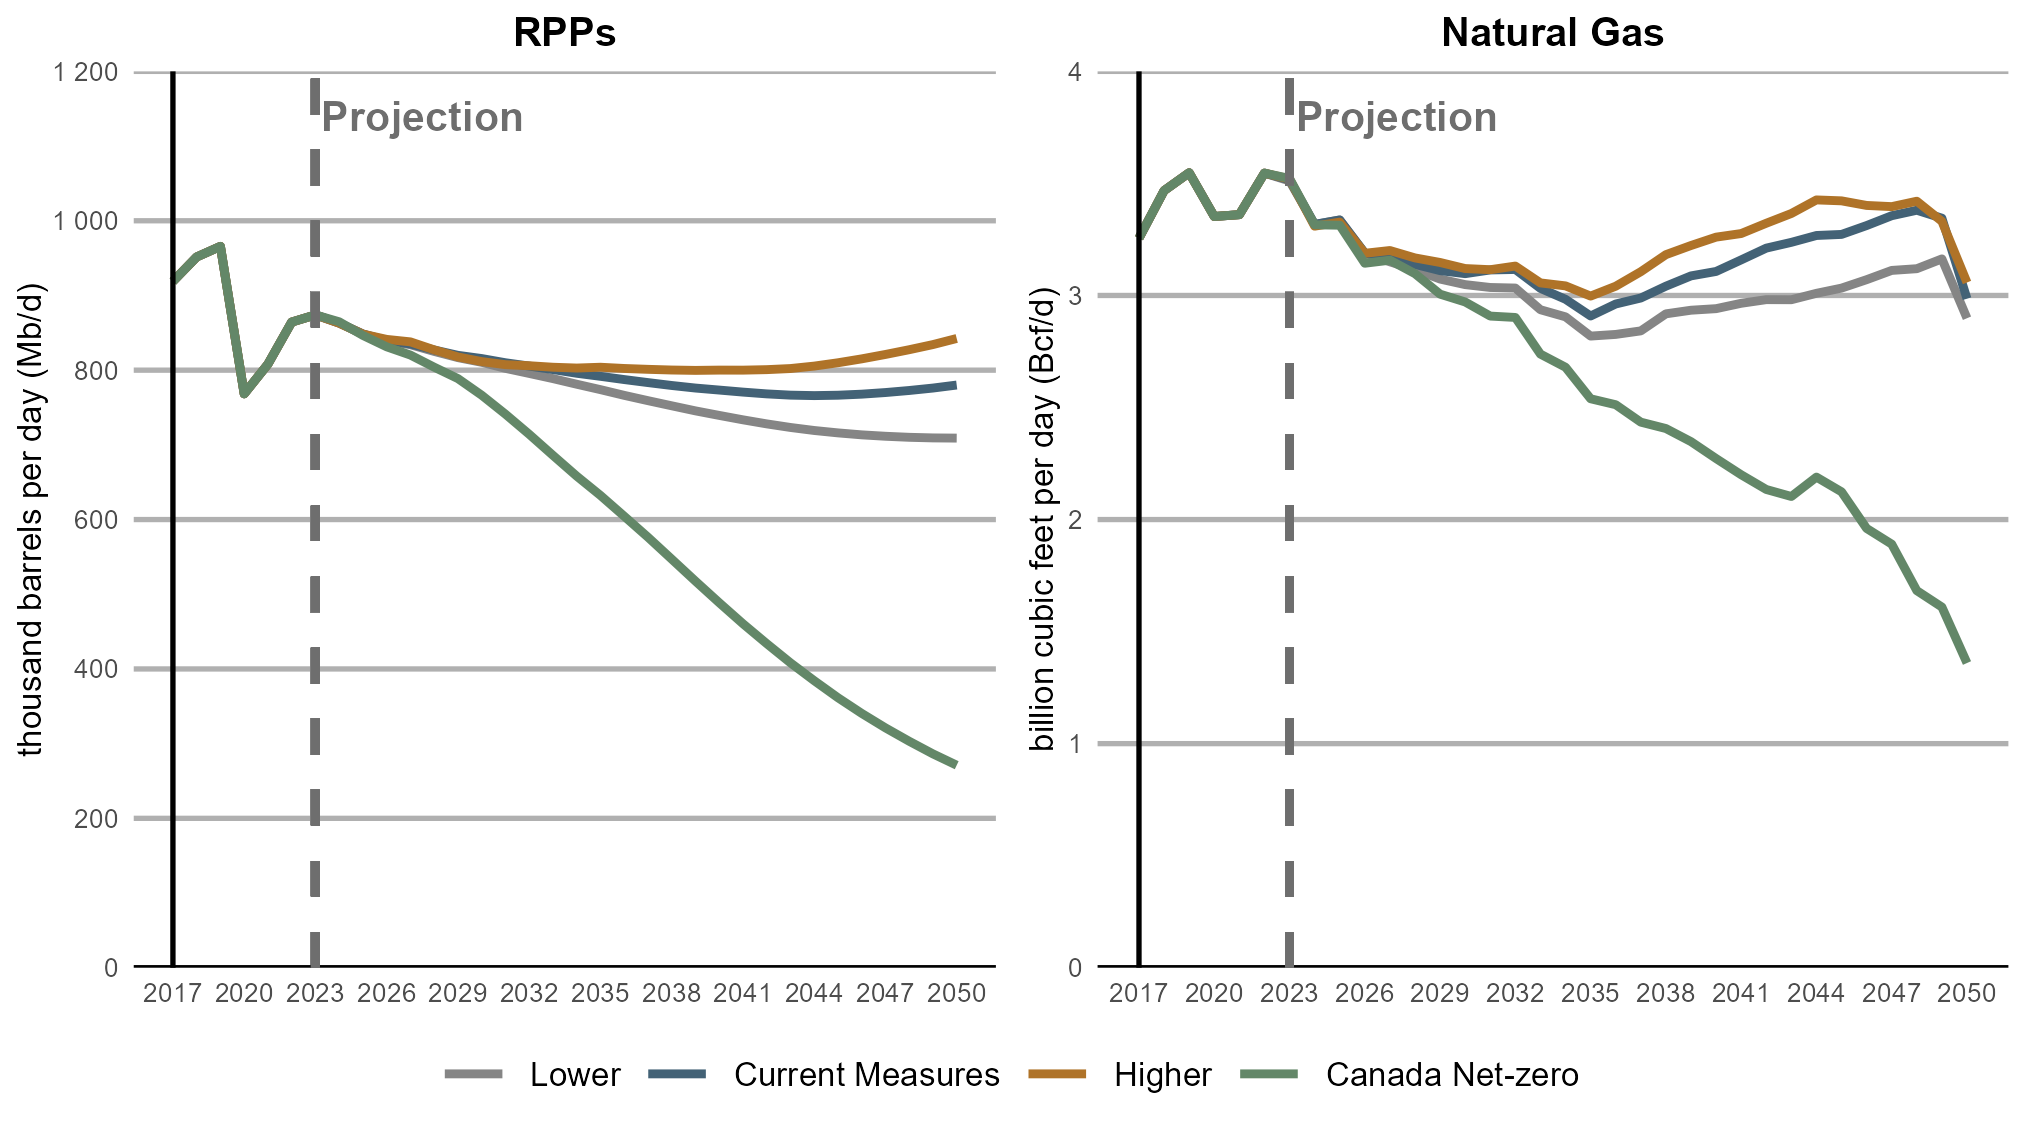
In most of our scenarios, central Canada’s refined petroleum product and natural gas use stays relatively stable, such that the region’s dependence on natural gas and crude oil produced in, or transiting through, the U.S. would continue based on current pipeline configurations. The region’s use of these commodities falls steadily in the Canada Net-zero scenario, which could increase its self-sufficiency.
Ontario and Quebec (i.e. Central Canada) depend on crude oil and natural gas from outside the region to meet their needs. The major pipeline systems delivering western Canadian crude oil and natural gas to the region currently have limited capacity to increase the volumes they deliver into central Canada. In addition, some segments of those pipelines transit through the U.S. before reaching central Canada. Accordingly, in the Current Measures, Lower and Higher scenarios, the region’s relatively steady use of refined petroleum products (RPPs) and natural gas over the projection period (Figure ES.8) implies that the region’s energy security would not significantly change, absent major infrastructure changes. In Canada Net-zero, lower RPP and natural gas use over the projection period could enhance energy self-sufficiency by increasing the share of energy that could be produced locally, such as electricity and hydrogen.
Text Alternative: This figure shows combined RPP and primary natural gas demand from 2017 to 2050 for each scenario. The left panel shows a line chart with combined RPP demand in thousand barrels per day (Mb/d). In the Current Measures, Higher, and Lower scenarios, demand remains relatively stable, or declines slightly, over the projection period. In the Canada Net-zero scenario, demand declines steadily throughout the period, falling substantially by 2050. The right panel shows a line chart with primary natural gas demand in billion cubic feet per day (Bcf/d). Demand is relatively stable over the projection period in the Current Measures, Higher, and Lower scenarios, declining slightly from 2025 to 2035 before climbing gradually through the remainder of the projection period. Demand in Canada Net-zero declines steadily throughout the projection period.
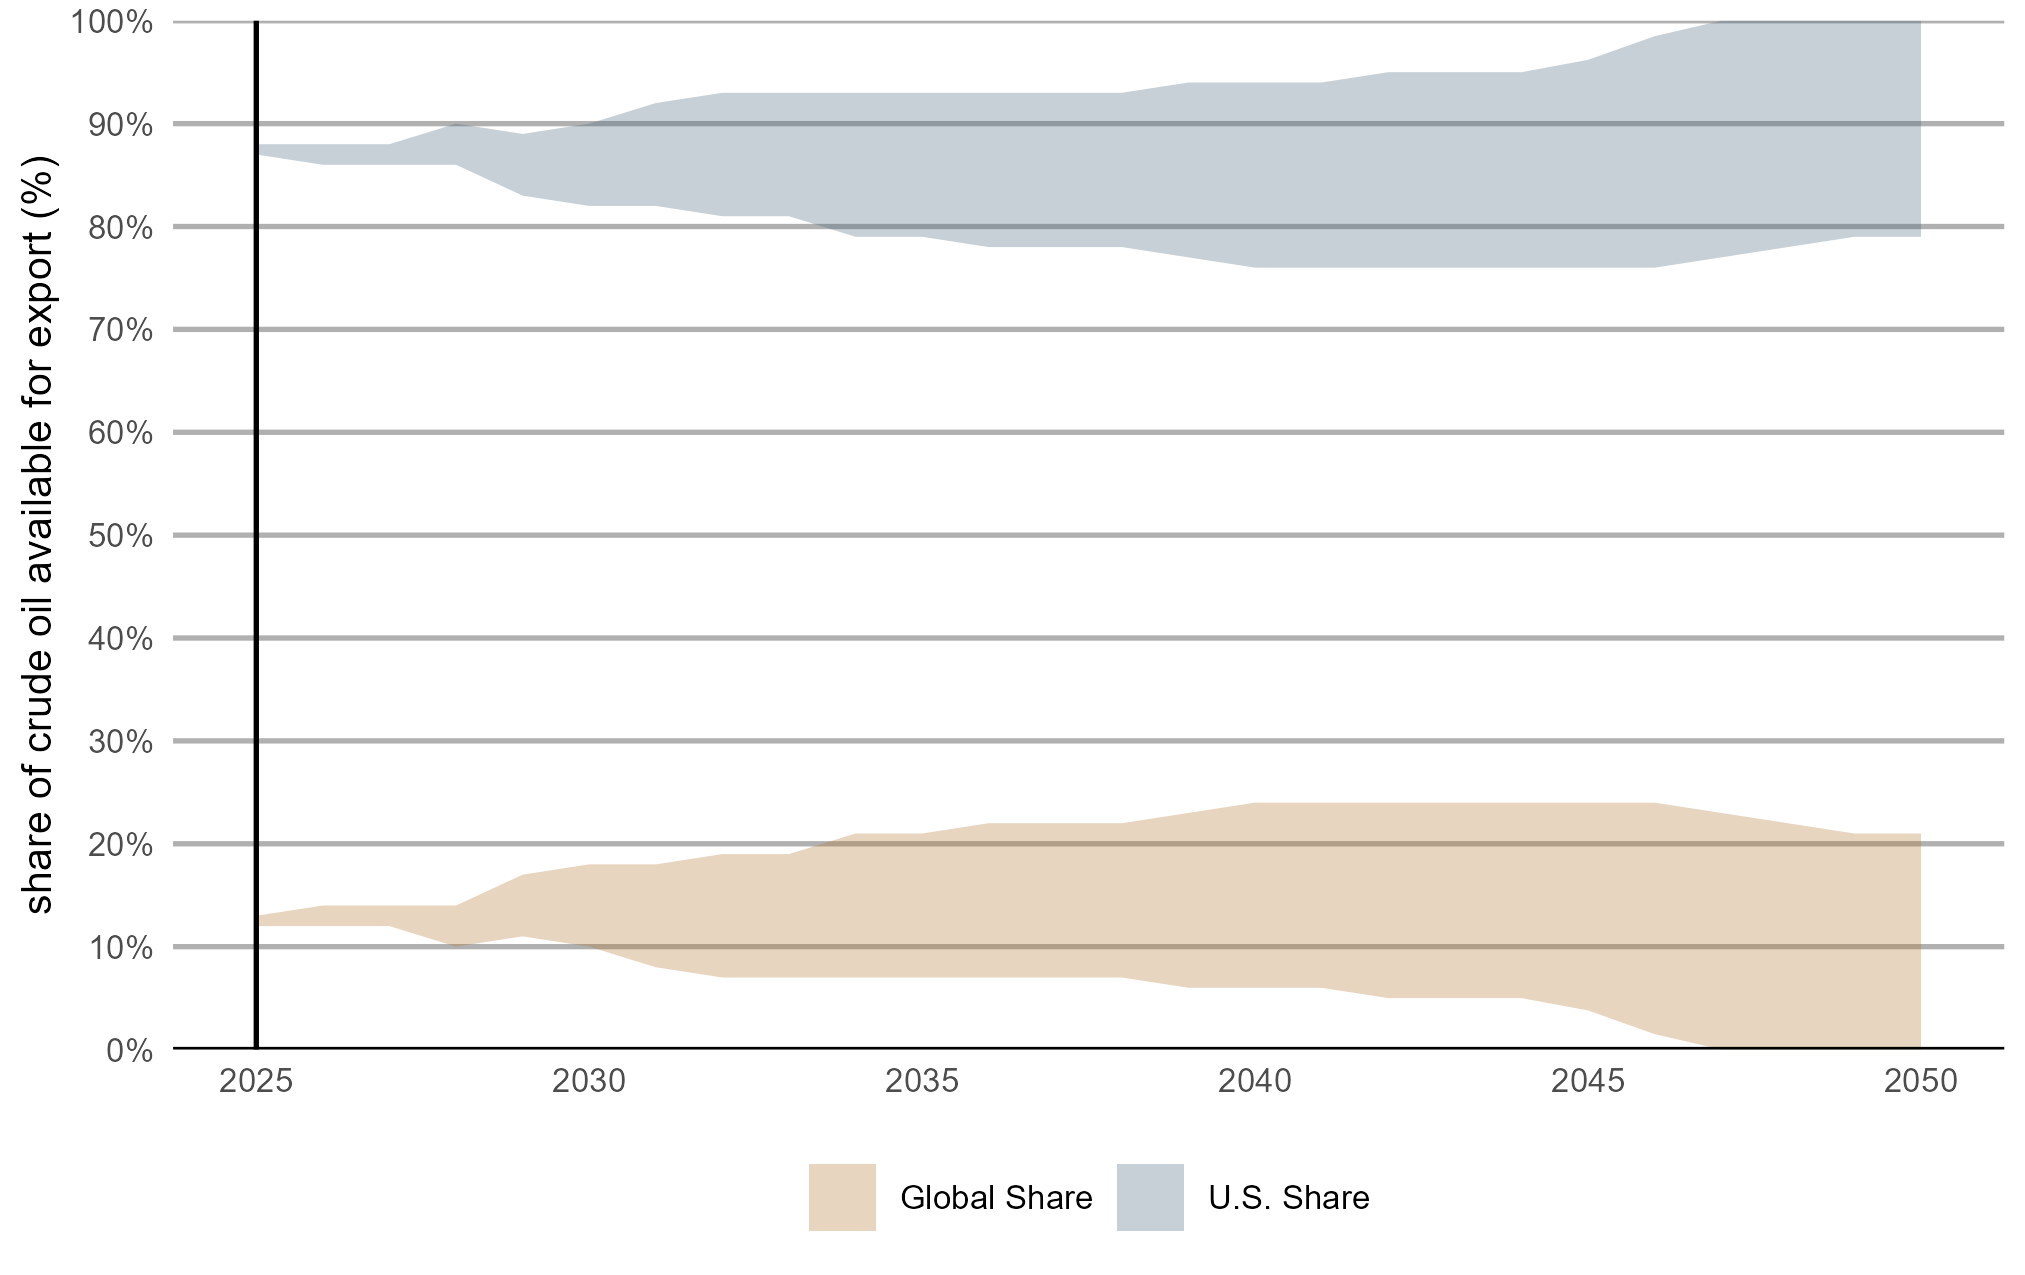
In all scenarios, crude oil production does not change enough to, on its own, markedly improve the diversity of Canada’s oil exports. Export diversity will depend, in large part, on investment decisions over the coming decades.
The vast majority of crude oil pipeline capacity exiting western Canada delivers to United States (U.S.) markets. Limited diversity in export markets can increase vulnerability to disruptions affecting crude oil producers and the broader economy.
The projections indicate that there is some potential to diversify Canada’s crude oil trade (Figure ES.9), though more significant change may be more challenging given the extent of existing infrastructure that is oriented towards the U.S. Diversification could be higher if crude oil production ends up being higher than in the scenarios in this report, which would lead to a greater increase in crude oil available for export and potential to reach global markets. Greater diversification could also be realized if crude oil pipeline capacity to access global markets was expanded such that overall capacity is well above crude oil available for export in our scenarios, and that additional capacity draws volumes away from the U.S. market.
Text Alternative: This chart shows the range of potential market share for western Canadian crude oil available for export. It shows the range for Global and U.S. markets as wedges that both grow from 2025 to 2050. The range representing global markets increases from around 13% in 2025 to a maximum of just above 25% and a minimum of zero. The U.S. range expands from around 88% in 2025 to a maximum of 100% and a minimum of 76%.
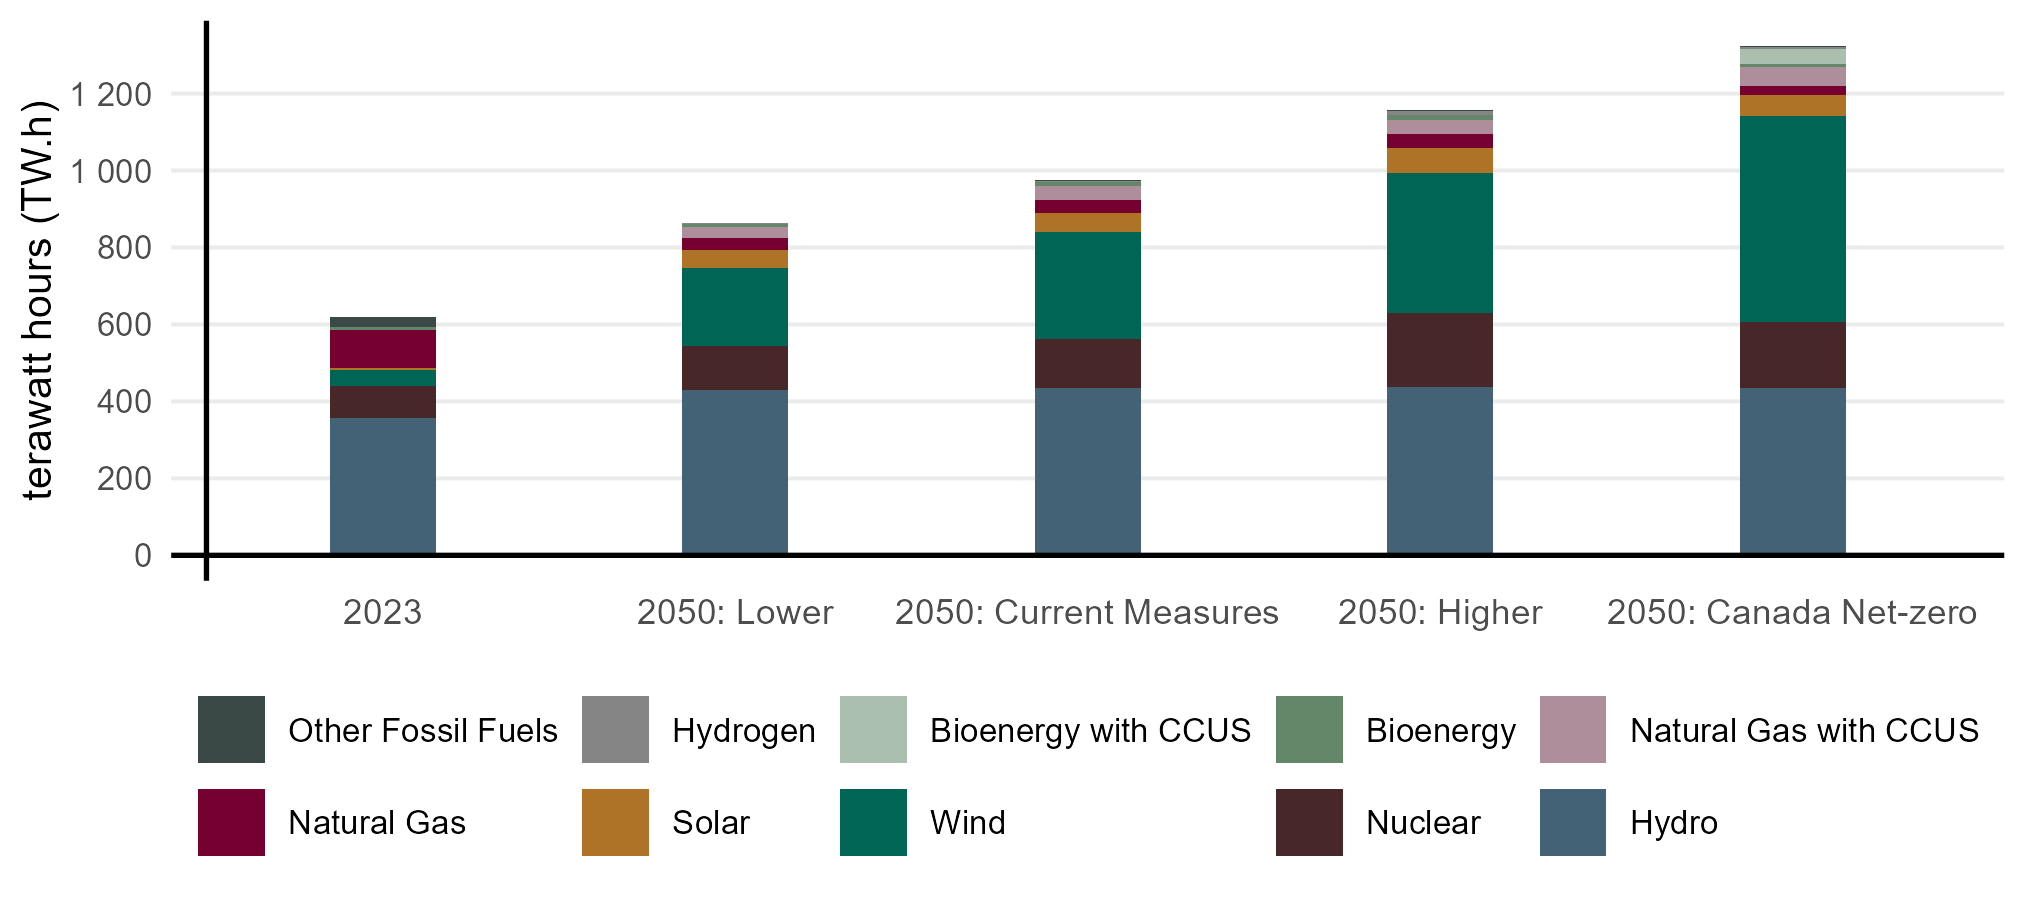
By 2050, electricity generation ranges from 30% higher, to more than double, current levels across the scenarios. The share of non- and low-emitting generation, which is about 80% currently, increases to over 96% in all scenarios.
All four scenarios see a significant shift in the electricity generation mix by 2050 (Figure ES.8). The key drivers for this change are:
All scenarios add more generation to meet rising demands, and by far the largest incremental source is wind energy. Increasing levels of variable renewable energy are supported by increasing generation from more stable and dispatchable sources, including hydroelectricity, nuclear, and natural gas with CCUS technologies. Natural gas generation without CCUS declines over the projection period, although its capacity remains near current levels to help support grid reliability. Canada Net-zero sees the addition of bioenergy generation with CCUS, a negative emission technology, which helps offset emissions from other sectors.
Text Alternative: This figure shows electricity generation by technology in 2023 and in 2050 across scenarios. For each year and scenario, total electricity generation is shown as stacked bars, with contributions from hydro, nuclear (including conventional and SMR technology), natural gas, natural gas with CCUS, other fossil fuels (coal and refined petroleum products), bioenergy, bioenergy with CCUS, hydrogen, solar, and wind (including onshore, offshore, and dedicated wind for hydrogen production). Total electricity generation is higher in 2050 across all scenarios compared with 2023, with the relative contribution of generation technologies varying across scenarios.
All scenarios feature additional non- and low- carbon generation by 2050, but the amount varies. In the Lower scenario, total generation increases by 245 terawatt hours (TWh), whereas in Canada Net-zero, generation increases by 705 TWh.
As part of our analysis on energy security, we review Canada’s supply chain resiliency for growing the electricity system. Growing Canada’s electricity supply as depicted in all scenarios will require considerable investment. These investments will depend on a complex global supply chain involved in producing physical components such as solar panels or natural gas turbines. The manufacturing of those components, and the extraction and processing of materials required to manufacture them, is often highly concentrated in individual countries, which is a risk to the resiliency of the supply chain. If the trend of growing electricity use around the world continues and possibly accelerates, there is potential for supply chain challenges to impact the cost and availability of different technologies, which could impact future generation trends.
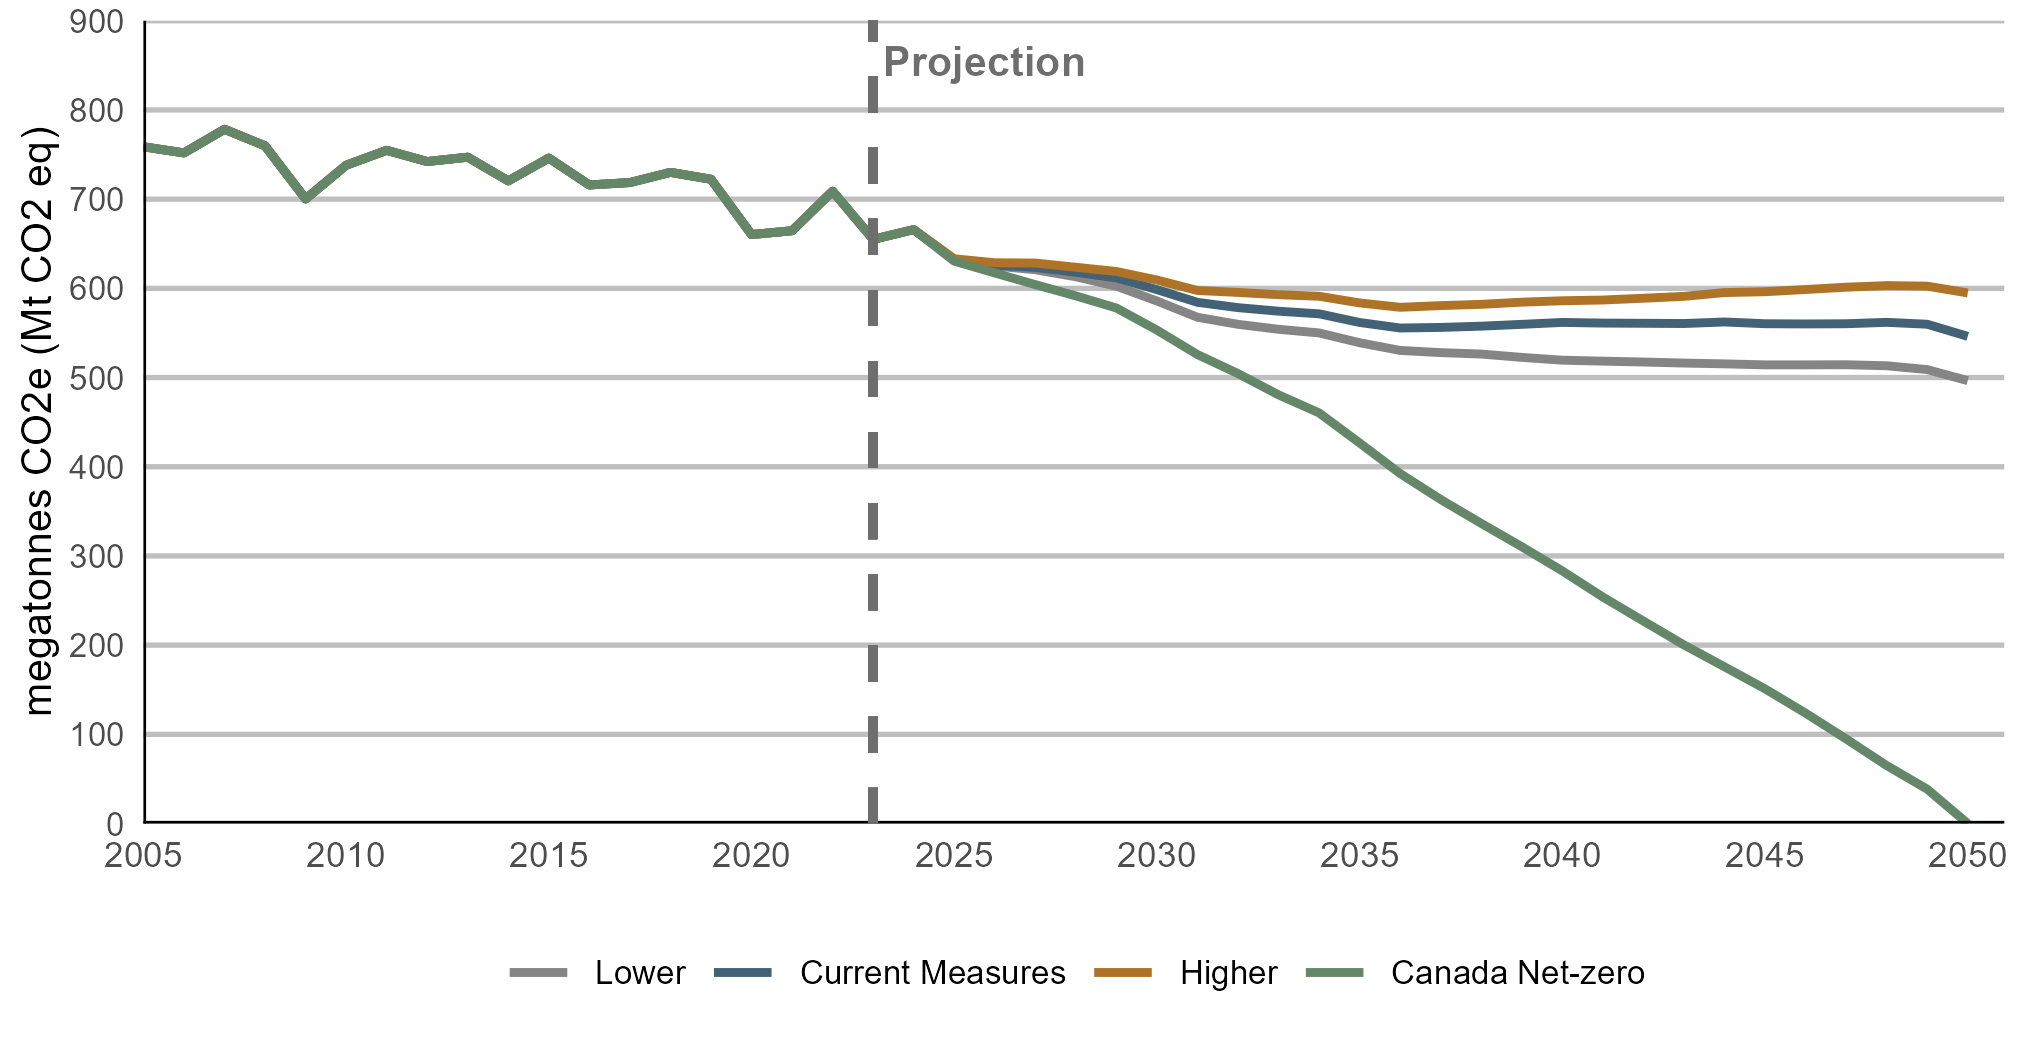
Decarbonizing the electricity system is an important driver of emission reductions in all scenarios but overall reductions largely plateau by around 2035 under current policies. Reaching net-zero by 2050 involves an economy-wide transformation towards low carbon technologies.
Canada’s GHG emissions fall in all scenarios (Figure ES.9). In Current Measures, Higher, and Lower scenarios, policy assumptions are fixed at current levels. This leads to falling emissions in the near term, but these reductions plateau—or in the Higher scenario, gradually reverse later in the projection. By 2050, GHG emissions in Current Measures are 28% below the 2005 benchmark year, and 17% lower than 2023 levels. The Higher and Lower scenarios provide a moderate range around this level, with the Higher scenario emissions 9% above Current Measures, and the Lower scenario 9% below, by 2050. Comparing these scenarios to Canada Net-zero, where emissions in 2050 have a predetermined endpoint, shows that additional policy action is required to achieve net-zero emissions.
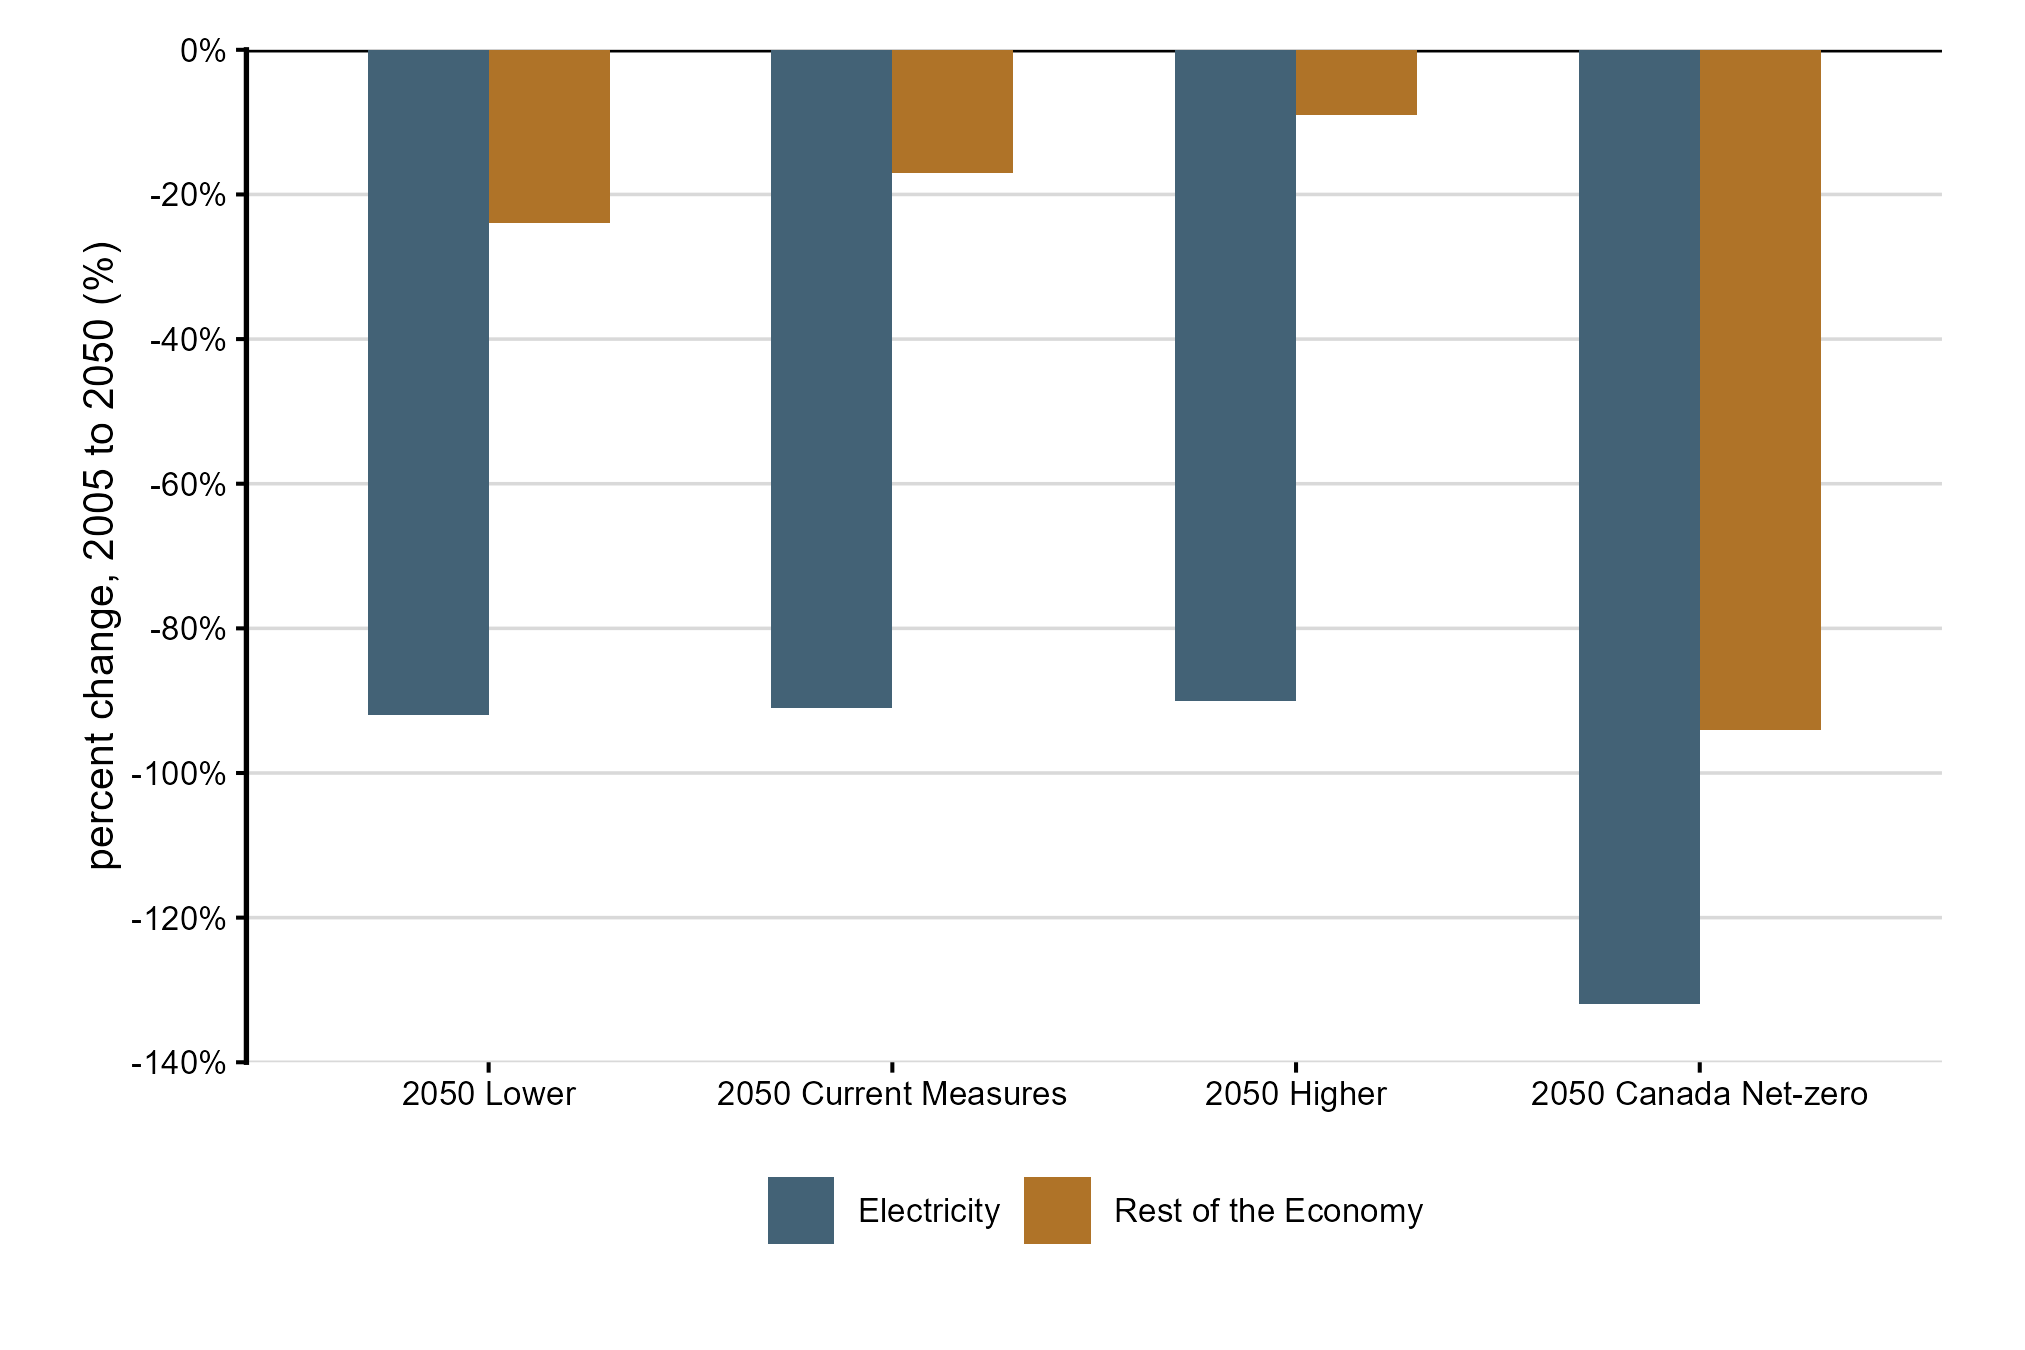
Across the economy, the electricity sector shows the greatest emission reductions, falling over 90% across the Current Measures, Higher and Lower scenarios by 2050 compared to the 2005 benchmark year. This deep decarbonization of the electricity sector exceeds the reductions of many other sectors even in Canada Net-zero. In Canada Net-zero, the electricity sector goes even further and becomes net-negative emissions through power generated using bioenergy coupled with CCUS technology. The Canada Net-zero scenario shows a pathway where the rest of the economy adopts transformative levels of new, low-carbon technologies (Figure ES.10).
Text Alternative: This line chart shows GHG emissions from 2005 to 2050 across the four scenarios. Emissions follow different trajectories over time, with values remaining higher in the Higher scenario, lower in the Lower scenario, and declining more steeply in the Canada Net-zero scenario, reaching near zero by 2050.
Text Alternative: This figure shows the percentage change in GHG emissions from 2005 to 2050 by scenario, separated into emissions from electricity and from the rest of the economy. Across all scenarios, emissions from electricity decline substantially by 2050, whereas emissions from the rest of the economy also decline, with the magnitude of change varying by scenario. The largest overall reductions occur in the Canada Net-zero scenario.