This section provides an overview of this report’s modeling results for the four scenarios. Additional details, including breakdowns by region, technology, and sector, can be found in the Energy Future datasets. Ways to access and explore the data:
The modeling and analysis for this report took place in late 2025. Our models rely primarily on historical data, which are actual values, up to, and including, 2023 for electricity and energy use statistics, and 2024 for oil and natural gas production statistics. Data points after these dates should be considered as projections. Historical statistics can be revised, and the values in this report will not account for adjustments made after mid-2025.
How does energy demand change over time across sectors over the projection?
Discover the data for yourself using our interactive visualization tool. View energy demand by sector.
This section discusses end-use (or “secondary”) energy demandFootnote 1 projections. End-use demand includes consumption of energy commodities, including electricity, hydrogen and fuels used for transportation, space heating, industrial processes, as well as non-combustion purposes such as lubricants and petrochemical feedstocks. It does not include the energy used to produce electricity and hydrogen.Footnote 2Footnote 3
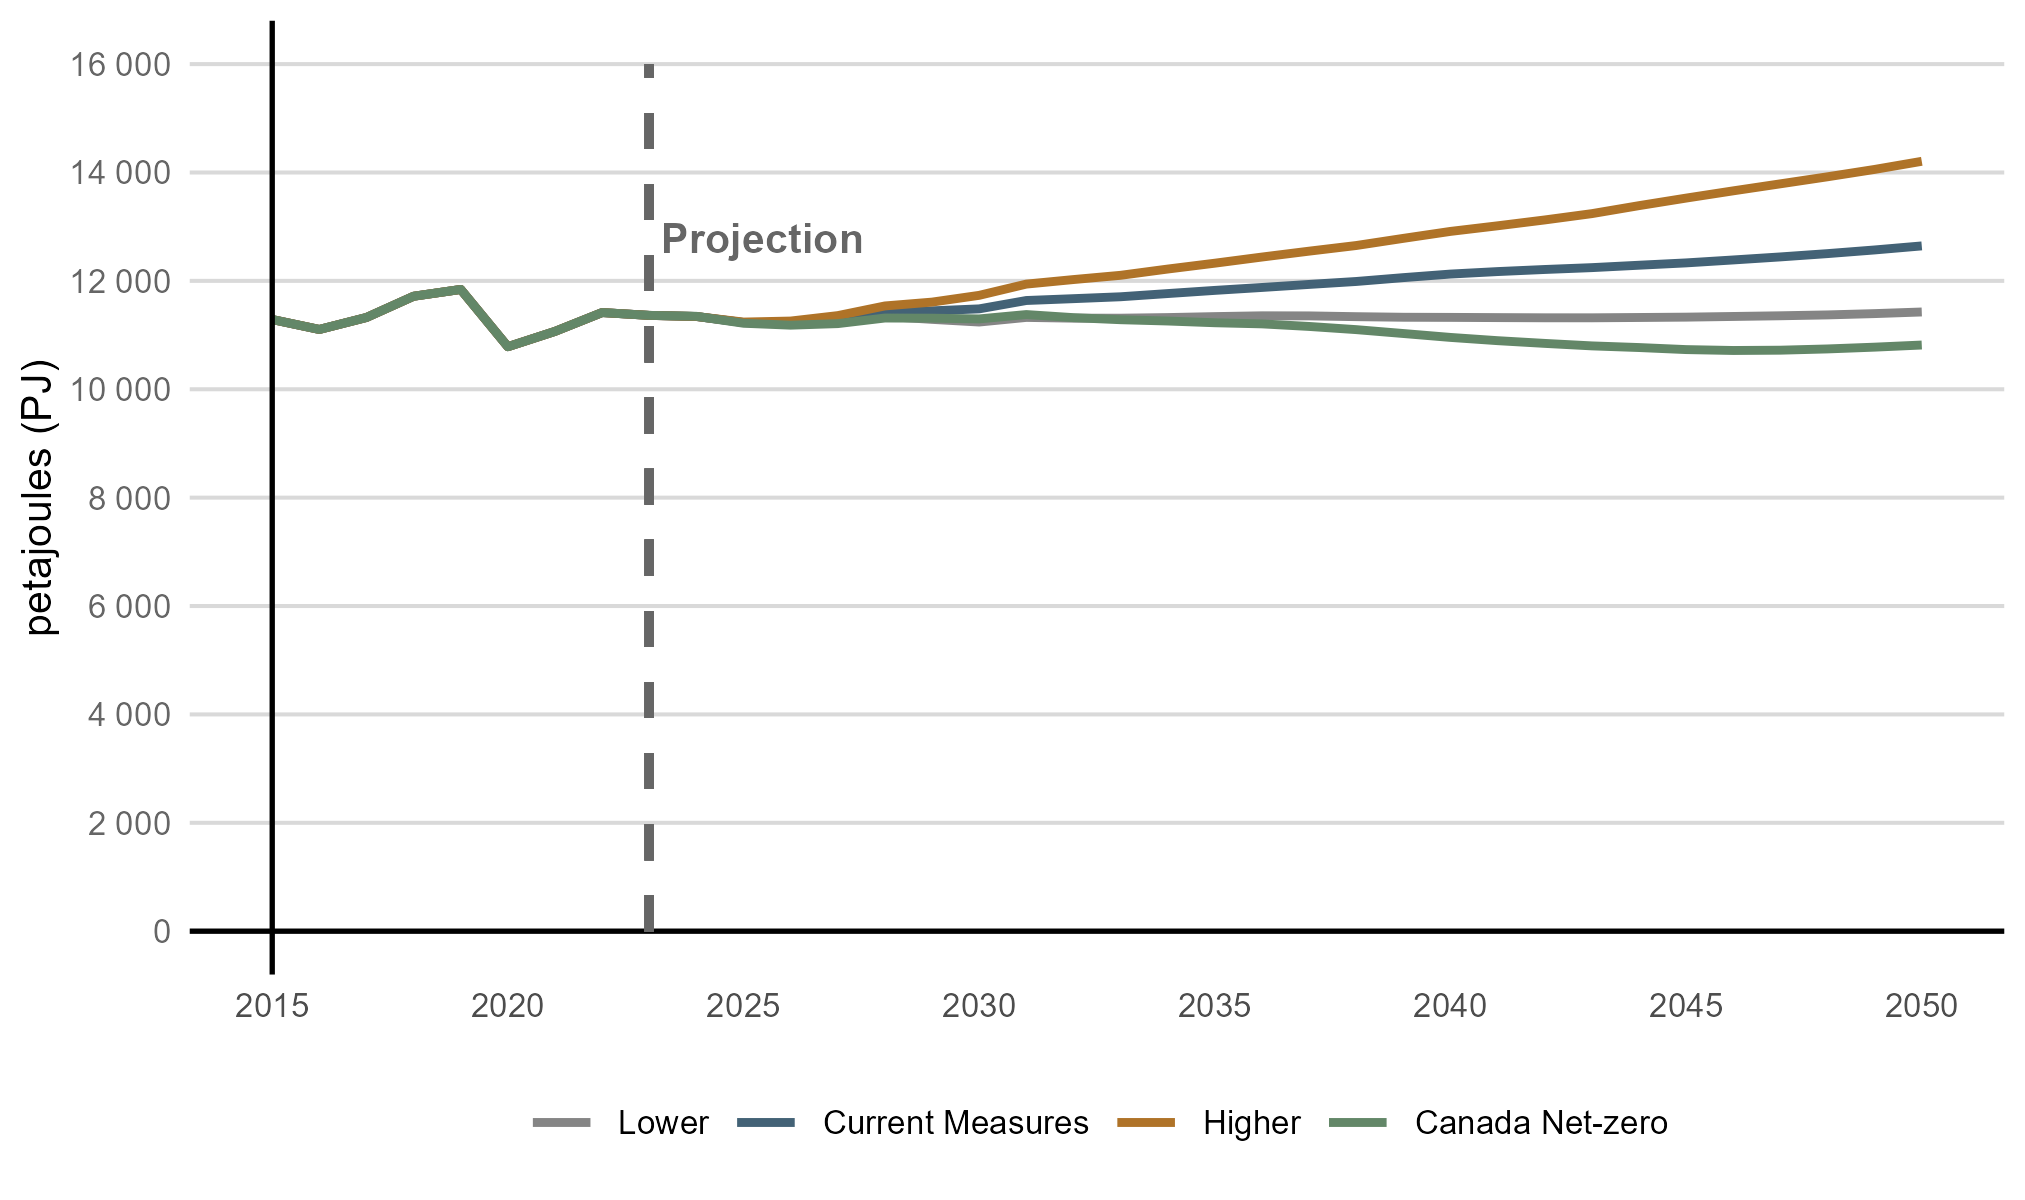
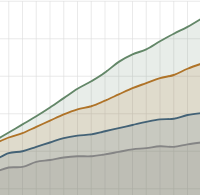
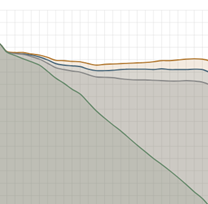
End-use demand grows moderately in Current Measures, faster in the Higher scenario, and slower in the Lower scenario and Canada Net-zero (Figure R.1). Overall, end-use demand grows by 11% in Current Measures from 2023 to 2050, compared to over 50% growth in real GDP over the same period. This implies Canada’s energy intensity, measured as energy use per $ of real GDP, falls by an average of 1.1% per year.Footnote 4
Relative to Current Measures, end-use demand is 12% higher by 2050 in the Higher scenario (about +1,560 PJ) and 10% lower in the Lower scenario (about -1,220 PJ). These trends are the result of the range of economic growth projections, higher or lower oil and natural gas activity, and higher or lower assumptions related to energy prices and data centre load growth. In Canada Net-zero, total demand is similar to the Lower scenario, but for different reasons. In Canada Net-zero, lower demand compared to Current Measures is driven by improving energy efficiency and adoption of more efficient electric technologies.
Text Alternative: This figure shows end-use energy demand across all scenarios. After remaining relatively flat until the late 2020s, end-use demand grows steadily in the Higher scenario, and to a lesser extent in Current Measures. End-use demand remains roughly at historical levels in the Lower and Canada Net-zero scenarios.
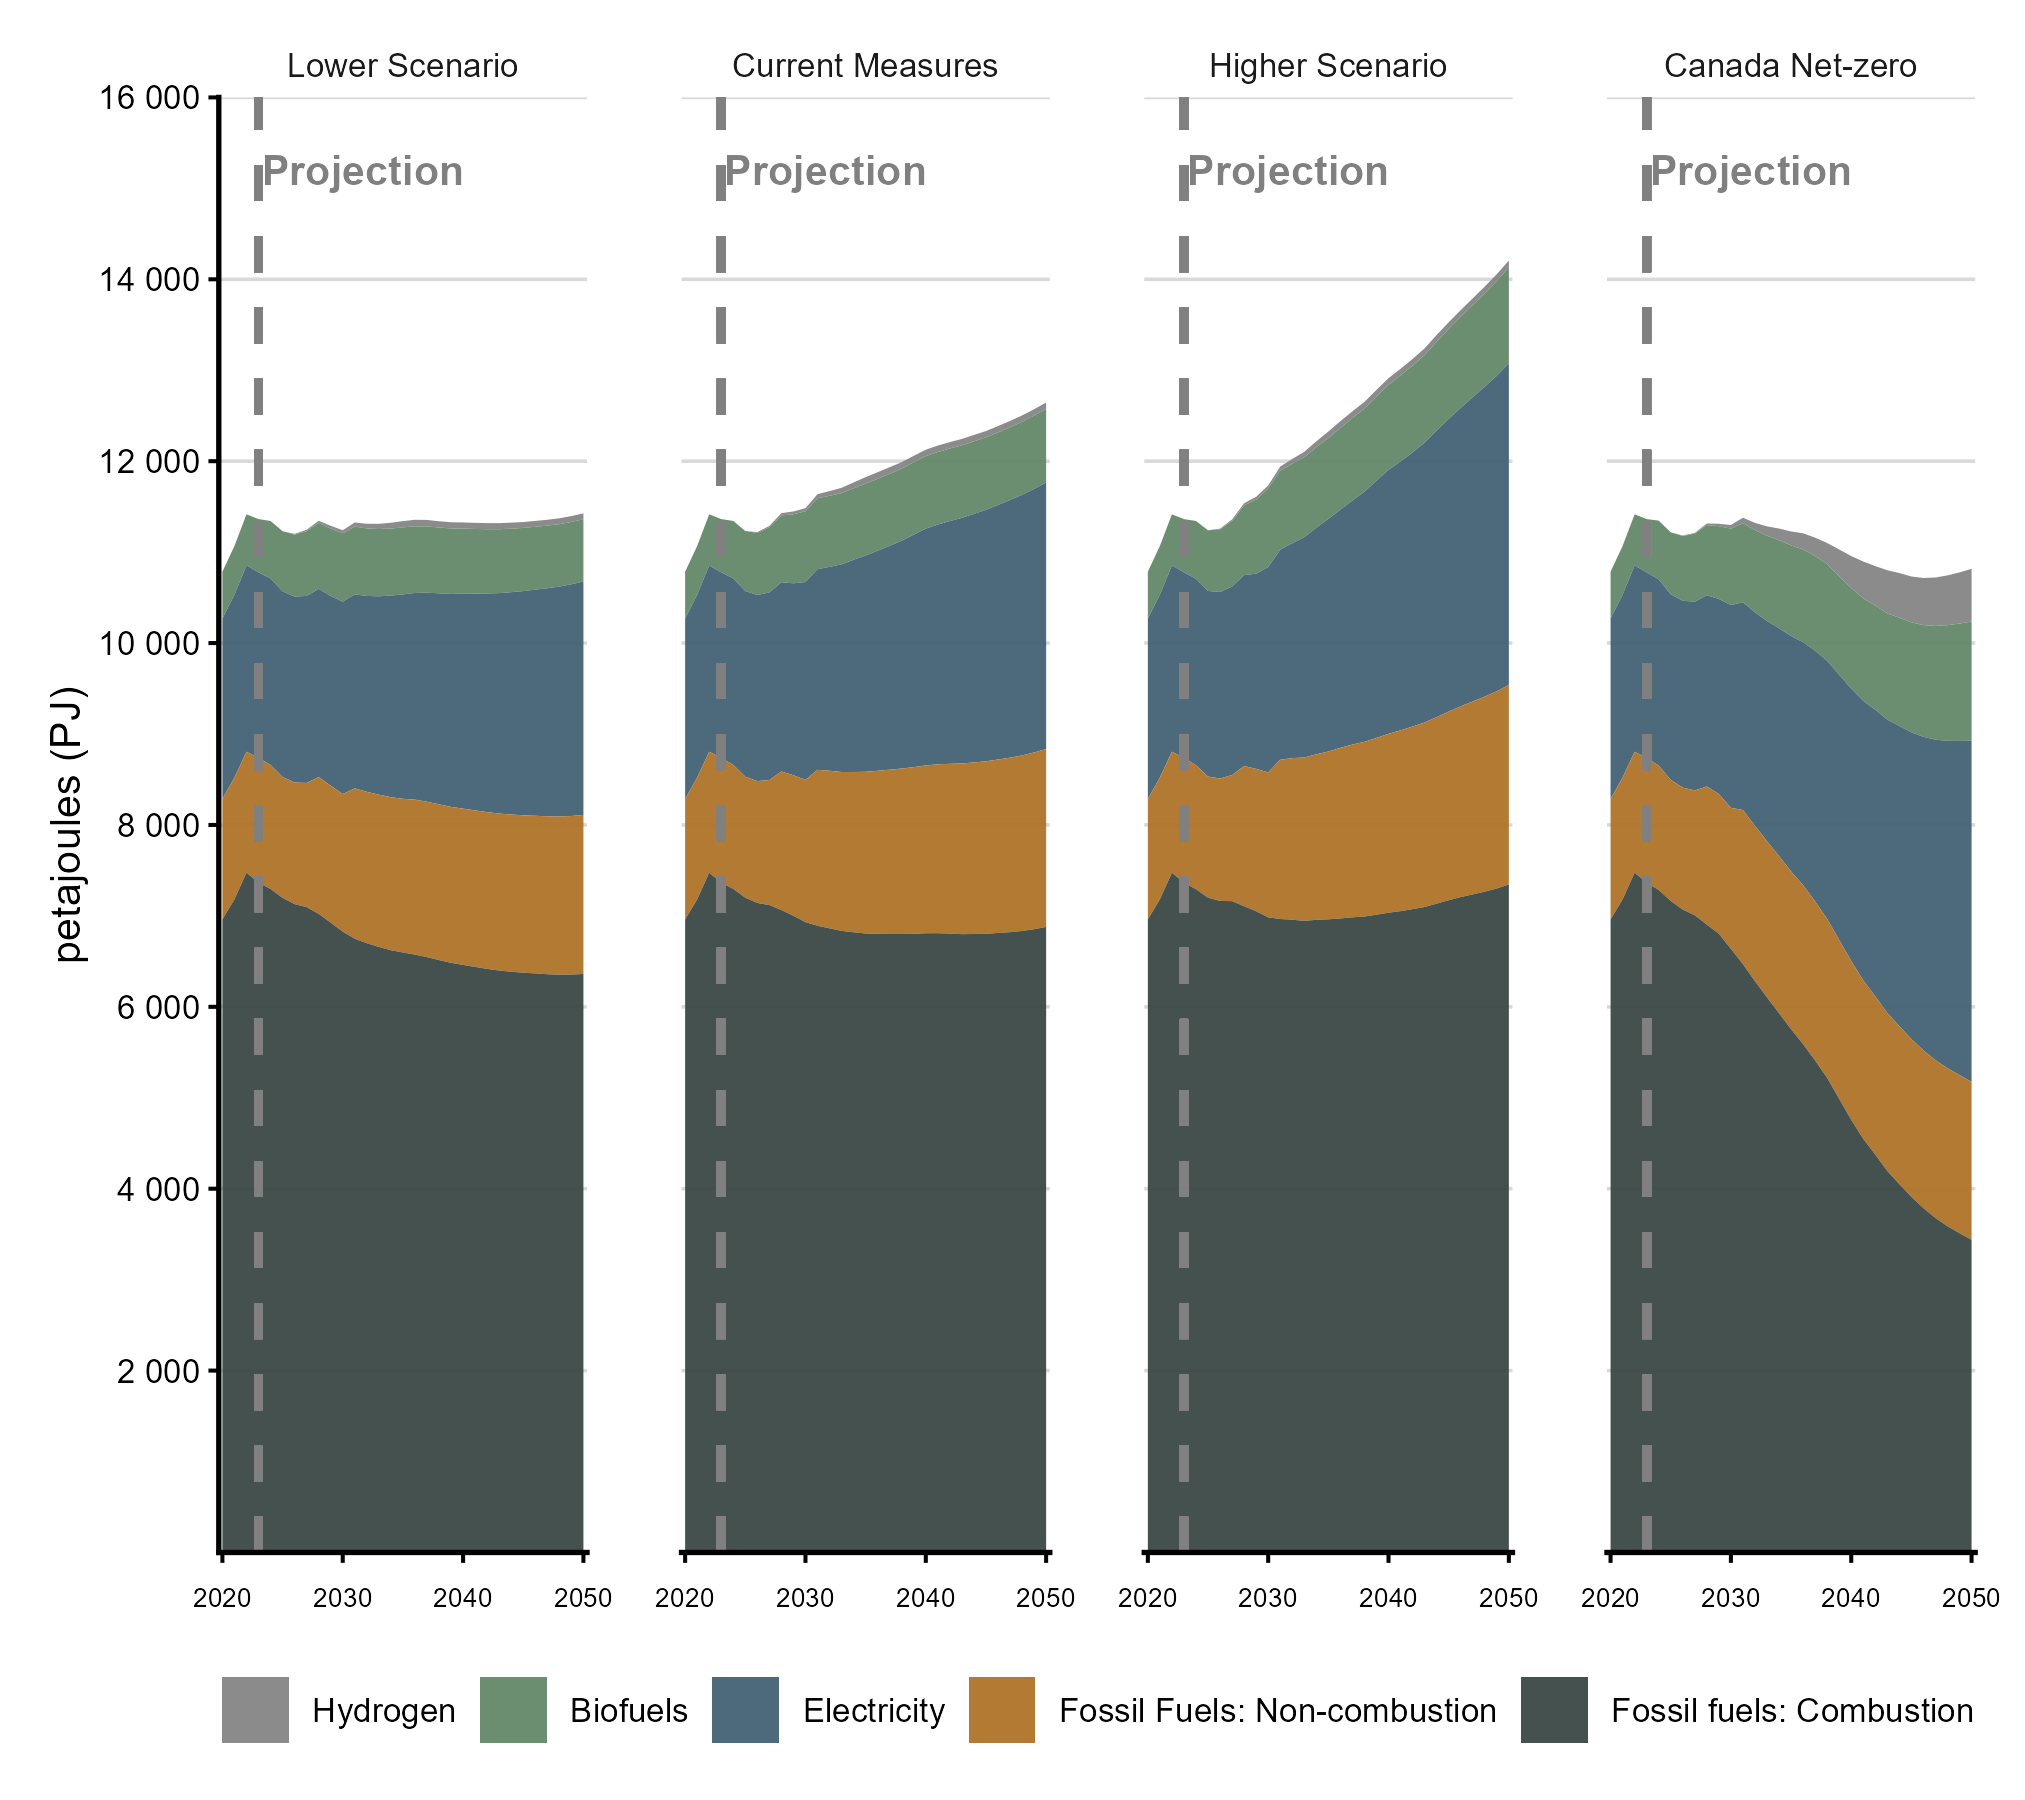
Fossil fuels (including natural gas, natural gas liquids, refined petroleum products, and coal) currently make up the majority of end-use demand in Canada (over 75% in 2023), and their use in the future varies across the scenarios (Figure R.2). In the near-term, fossil fuel combustion falls. This is due to shifts towards biofuels and electricity, driven by policies such as Canada’s Clean Fuels Regulations and the Electric Vehicle Availability StandardFootnote 5, as well as improving energy efficiency. Longer term economic growth, as well as oil and natural gas production trends (producing crude oil and natural gas is energy intensive), determine fossil fuel demand trends in the longer term. Canada Net-zero shows the largest amount of change in the energy mix, as increasing climate action drives down fossil fuel combustion. By 2050, some fossil fuel demand for combustion remains in Canada Net-zero and is either from processes equipped with CCUS (for example, by 2050 heavy industry sequesters 22 MT per year via CCUS, and the oil and natural gas sector sequesters 51 MT) or where emissions are offset by other sectors. Emissions are offset where it is more costly to adopt clean fuels and/or it takes longer for capital stocks to turnover.
Fossil fuels used for non-combustion purposes, such as petrochemical feedstocks, asphalt, and lubricants, grow in all scenarios. This implies that a greater share of fossil fuel demand goes towards non-combustion uses in the future. In 2050, the share of total fossil fuel demand used for non-combustion purposes is 22% in Current Measures and 33% in Canada Net-zero, compared to around 15% currently.
Across all four scenarios, electricity shows the largest percentage increase in demand from 2023 to 2050Footnote 6, ranging from 26% in the Lower scenario, 44% in Current Measures, 73% in the Higher scenario, and 84% in Canada Net-zero (Figure R.2). End-use biofuelFootnote 7 demand also grows in all four scenarios. Low and non-emitting hydrogen becomes a bigger part of the end-use mix in Canada Net-zero (production increases in all scenarios due to hydrogen produced for export, as discussed in the Hydrogen section later in this chapter).
Text Alternative: This figure compares end-use energy demand by energy source across all scenarios. Electricity and bioenergy both increase in all scenarios, especially so in the Canada Net-zero scenario. Hydrogen only sees significant growth in the Canada Net-zero scenario and remains near zero in the other ones.
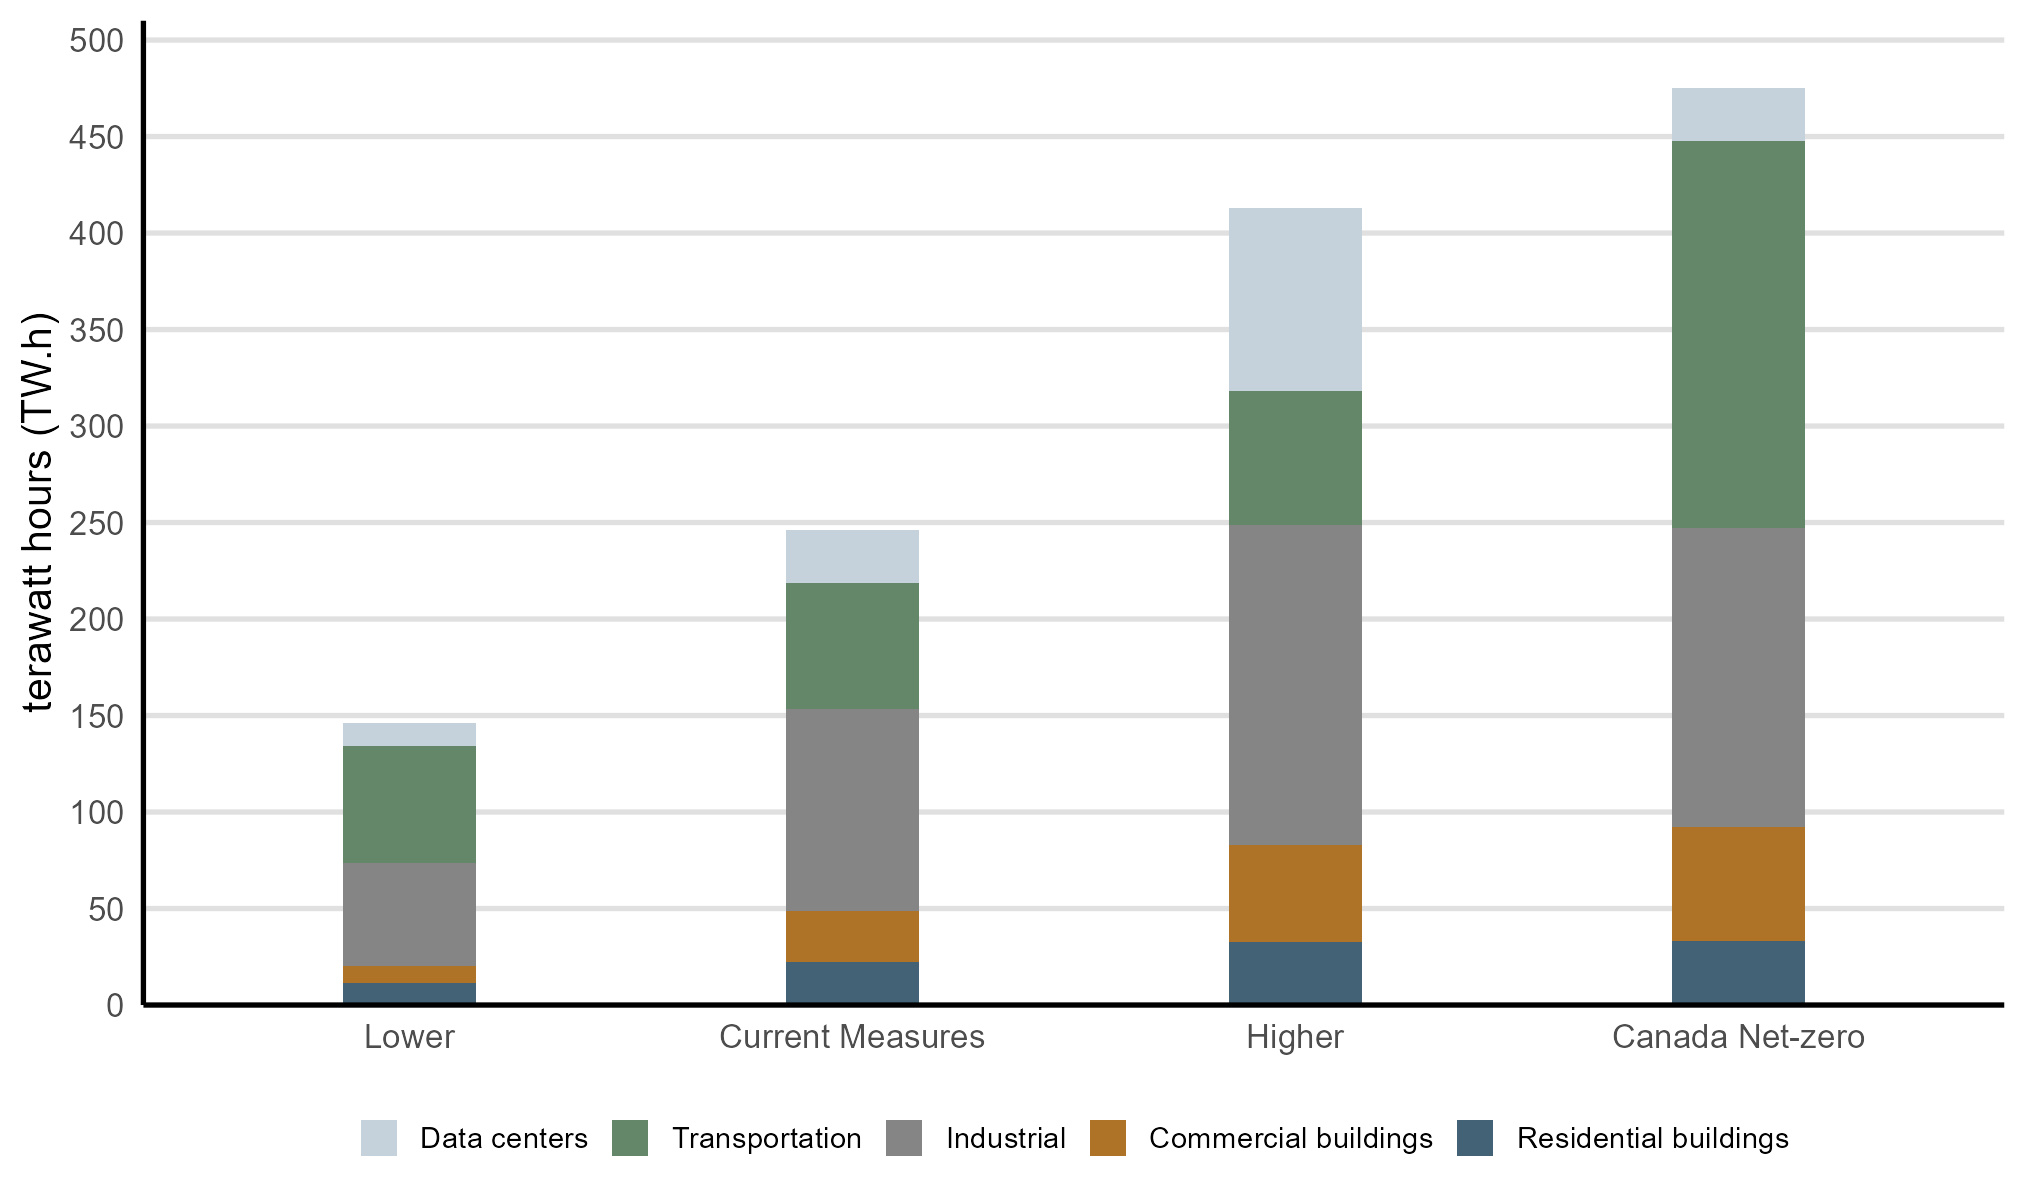
Growth in electricity demand varies across scenarios in terms of how much total electricity demand is added, and where the growth is coming from (Figure R.3). One of the key assumptions that influence electricity demand in our scenarios is data centre load growth. In the Higher scenario, data centre load growth makes up about a quarter, or 100 TWh, of the total projected end-use electricity demand growth. Electricity demand is also driven by economic activity. Commercial and industrial loads grow faster and slower in the Higher and Lower scenarios, respectively. Climate policy and clean technology adoption also play an important role, particularly through electrification of end uses and improvements in energy efficiency.
In the buildings sector, electricity demand is closely linked to total floorspace, as larger residential and commercial building stock requires more energy for lighting, heating, cooling, and appliances. As a result, differences in electricity demand across the Lower and Higher scenarios are largely driven by changes in floorspace. In contrast, electricity demand in Canada Net-zero grows faster than in the Higher scenario despite lower floorspace growth. While the Higher scenario has nearly 10% more residential and commercial floorspace by 2050 and smaller improvements in building shell efficiency, Canada Net-zero sees higher electricity demand due to a greater uptake of electrified technologies, such as heat pumps.
Text Alternative: This figure shows growth in electricity demand from 2023 to 2050 by sector across the four scenarios. Total growth is lowest in the Lower scenario and highest in Canada Net-zero. Across scenarios, residential and commercial buildings, industrial uses, transportation, and data centres all see notable growth. The relative contributions differ by scenario: in the Lower scenario, increases are modest across all sectors except for transportation, whereas in the Current Measures and the Higher scenarios, growth is larger, particularly in data centres, commercial buildings, and industrial uses. The Canada Net-zero scenario shows the largest increases overall, with transportation and industrial sectors contributing the most, followed by notable growth in residential and commercial buildings.
We model the electricity capacity and generation necessary to meet the electricity needs outlined in the Energy Demand section, plus the electricity exported to the U.S. and electricity used to produce hydrogen. The analysis is done at an hourly level for each year of our projection, and accounts for any future changes in load patterns that follow from the demand trends, such as increased electrification of heating and transportation.
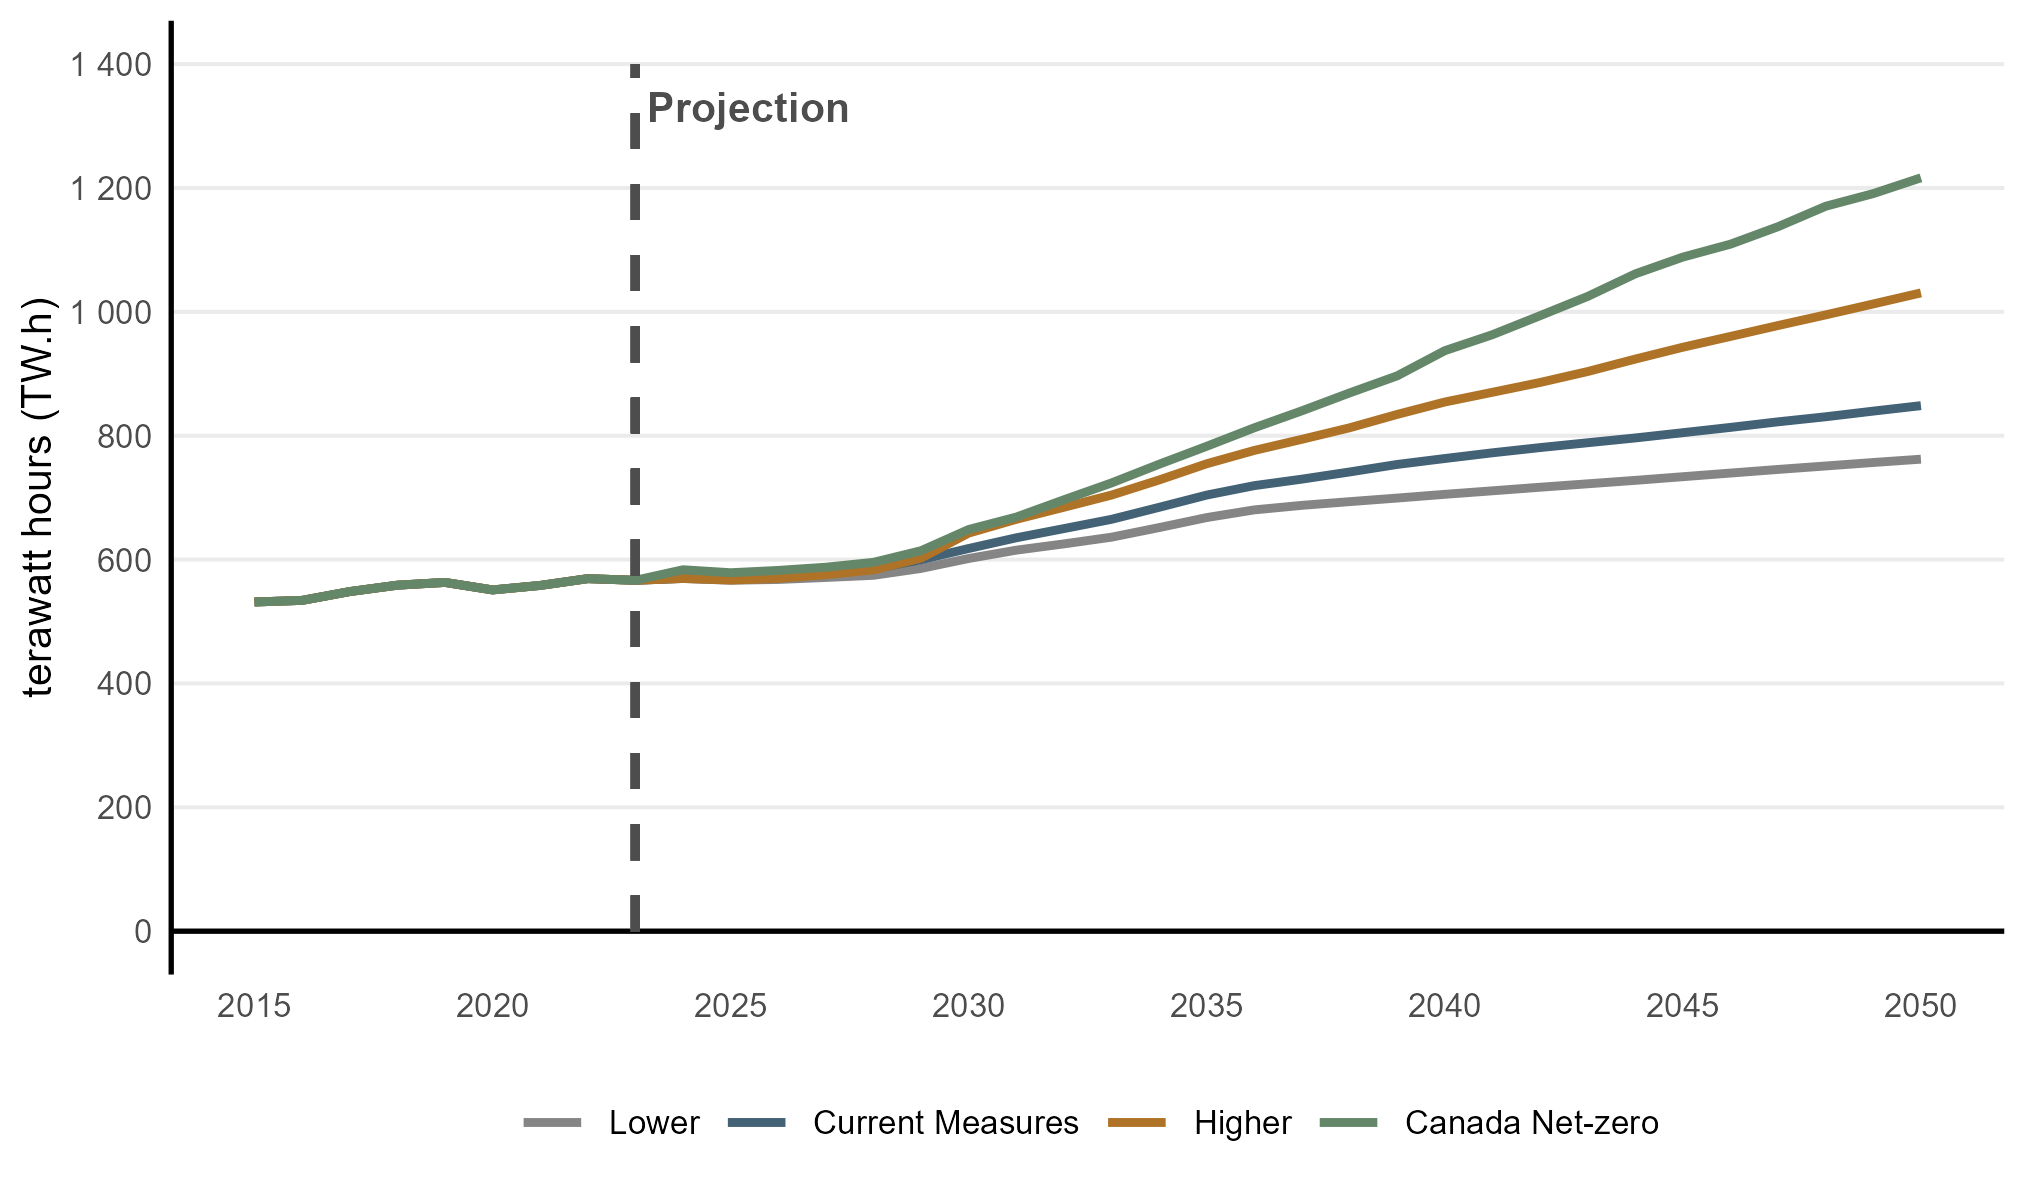
Canadian electricity demand—including end-use electricity described in the previous section, as well as electricity used to produce hydrogen—grows in all four scenarios, but with a large variation across them. The Lower scenario has the lowest demand, but still grows by 30% from 2023 to 2050, or a compound average annual growth of 1%, which is similar to recent historical levels. Current Measures increases by nearly 50% from 2023 to 2050, the Higher scenario by 80%, and Canada Net-zero by nearly 120%.
Text Alternative: This figure shows electricity demand growth from 2010 to 2050 in all scenarios. Electricity demand remains relatively stable until the late-2020s, after which it increases in all scenarios. The rate of growth differs, with the slowest increase being in the Lower scenario, where it increases by around 30% by 2050, and the fastest being in Canada Net-zero, where it more than doubles over the same period.
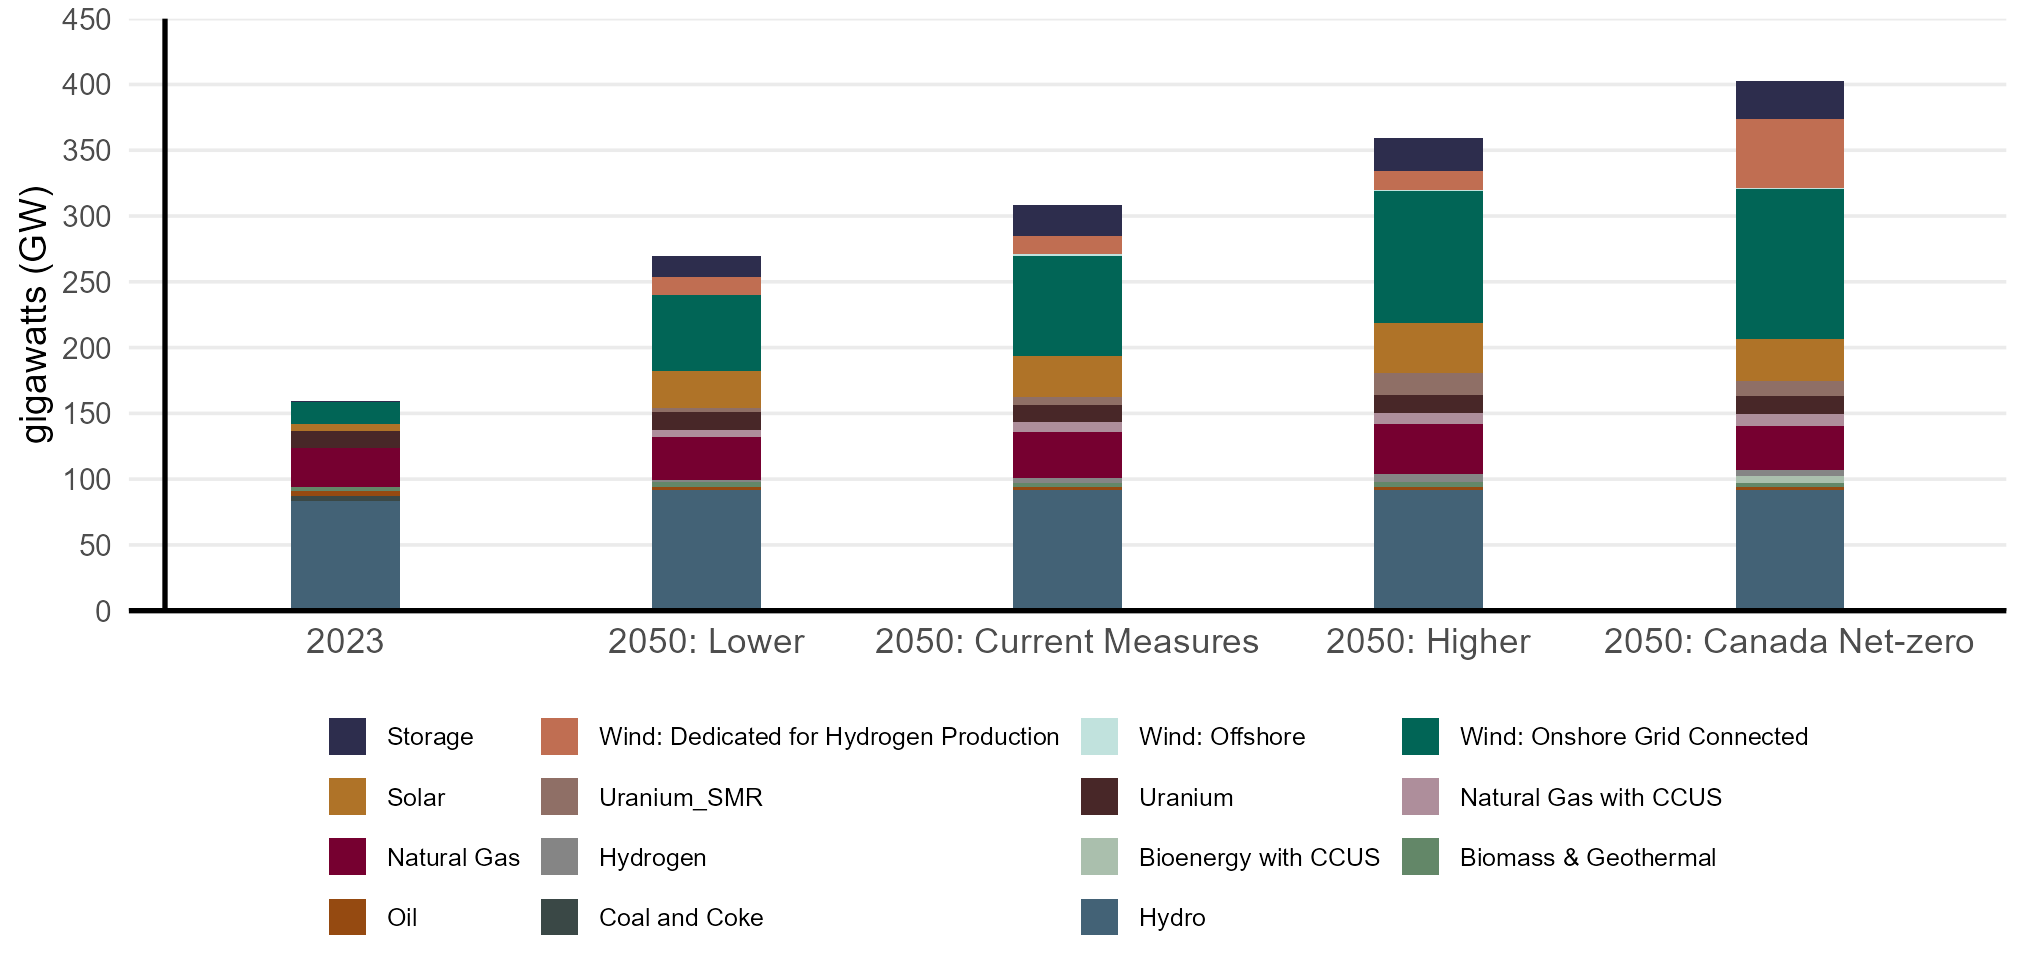
To meet these rising demands while maintaining adequate system reliability, installed electricity capacity (the total maximum power output of all generating facilities) increases as well (Figure R.5). In Current Measures, capacity increases from around 160 GW in 2023 to 310 GW in 2050. In 2050, capacity reaches 270 GW in the Lower scenario and 360 GW in the Higher scenario. Capacity rises to 400 GW by 2050 in Canada Net-zero.
In all scenarios, wind energy makes up the largest capacity additions, with around 50 to 150 GW added from 2023 to 2050 across the scenarios. Most wind additions are from onshore wind that provides energy to the grid, while offshore wind plays a role in Atlantic Canada. We assume that most hydrogen produced via electrolysis is powered by dedicated wind generation, which adds to wind capacity in all scenarios. Depending on the scenario, around 20-30 GW of solar capacity and 15-23 GW of battery storage are added by 2050.
To ensure the electricity system can quickly respond to changes in electricity demand and variability in output from resources like wind and solar, our modeling shows significant additional capacity, including large amounts of natural gas with CCUS, nuclear (mostly small modular reactors), and hydroelectricity. In Canada Net-zero, emerging technologies such as bioenergy with CCUS—which allow for negative emissions—play a significant role. Natural gas capacity without CCUS grows in Current Measures and the Higher scenario and remains near current levels in the Lower scenario and Canada Net-zero.
Text Alternative: This figure shows electricity generation capacity by technology in 2023 and for each scenario in 2050. In all scenarios, total capacity increases over time. While hydro is the largest single source in 2023 and it expands modestly, wind and solar see the largest growth across scenarios. In all scenarios except the Lower scenario, by 2050, wind becomes the largest source. Natural gas capacity grows, with growth coming from natural gas with carbon capture and storage (CCUS). Canada Net-zero shows the largest total capacity in 2050, driven by higher levels of renewables and emerging technologies like nuclear SMR, natural gas with CCUS, storage, and bioenergy with CCUS.
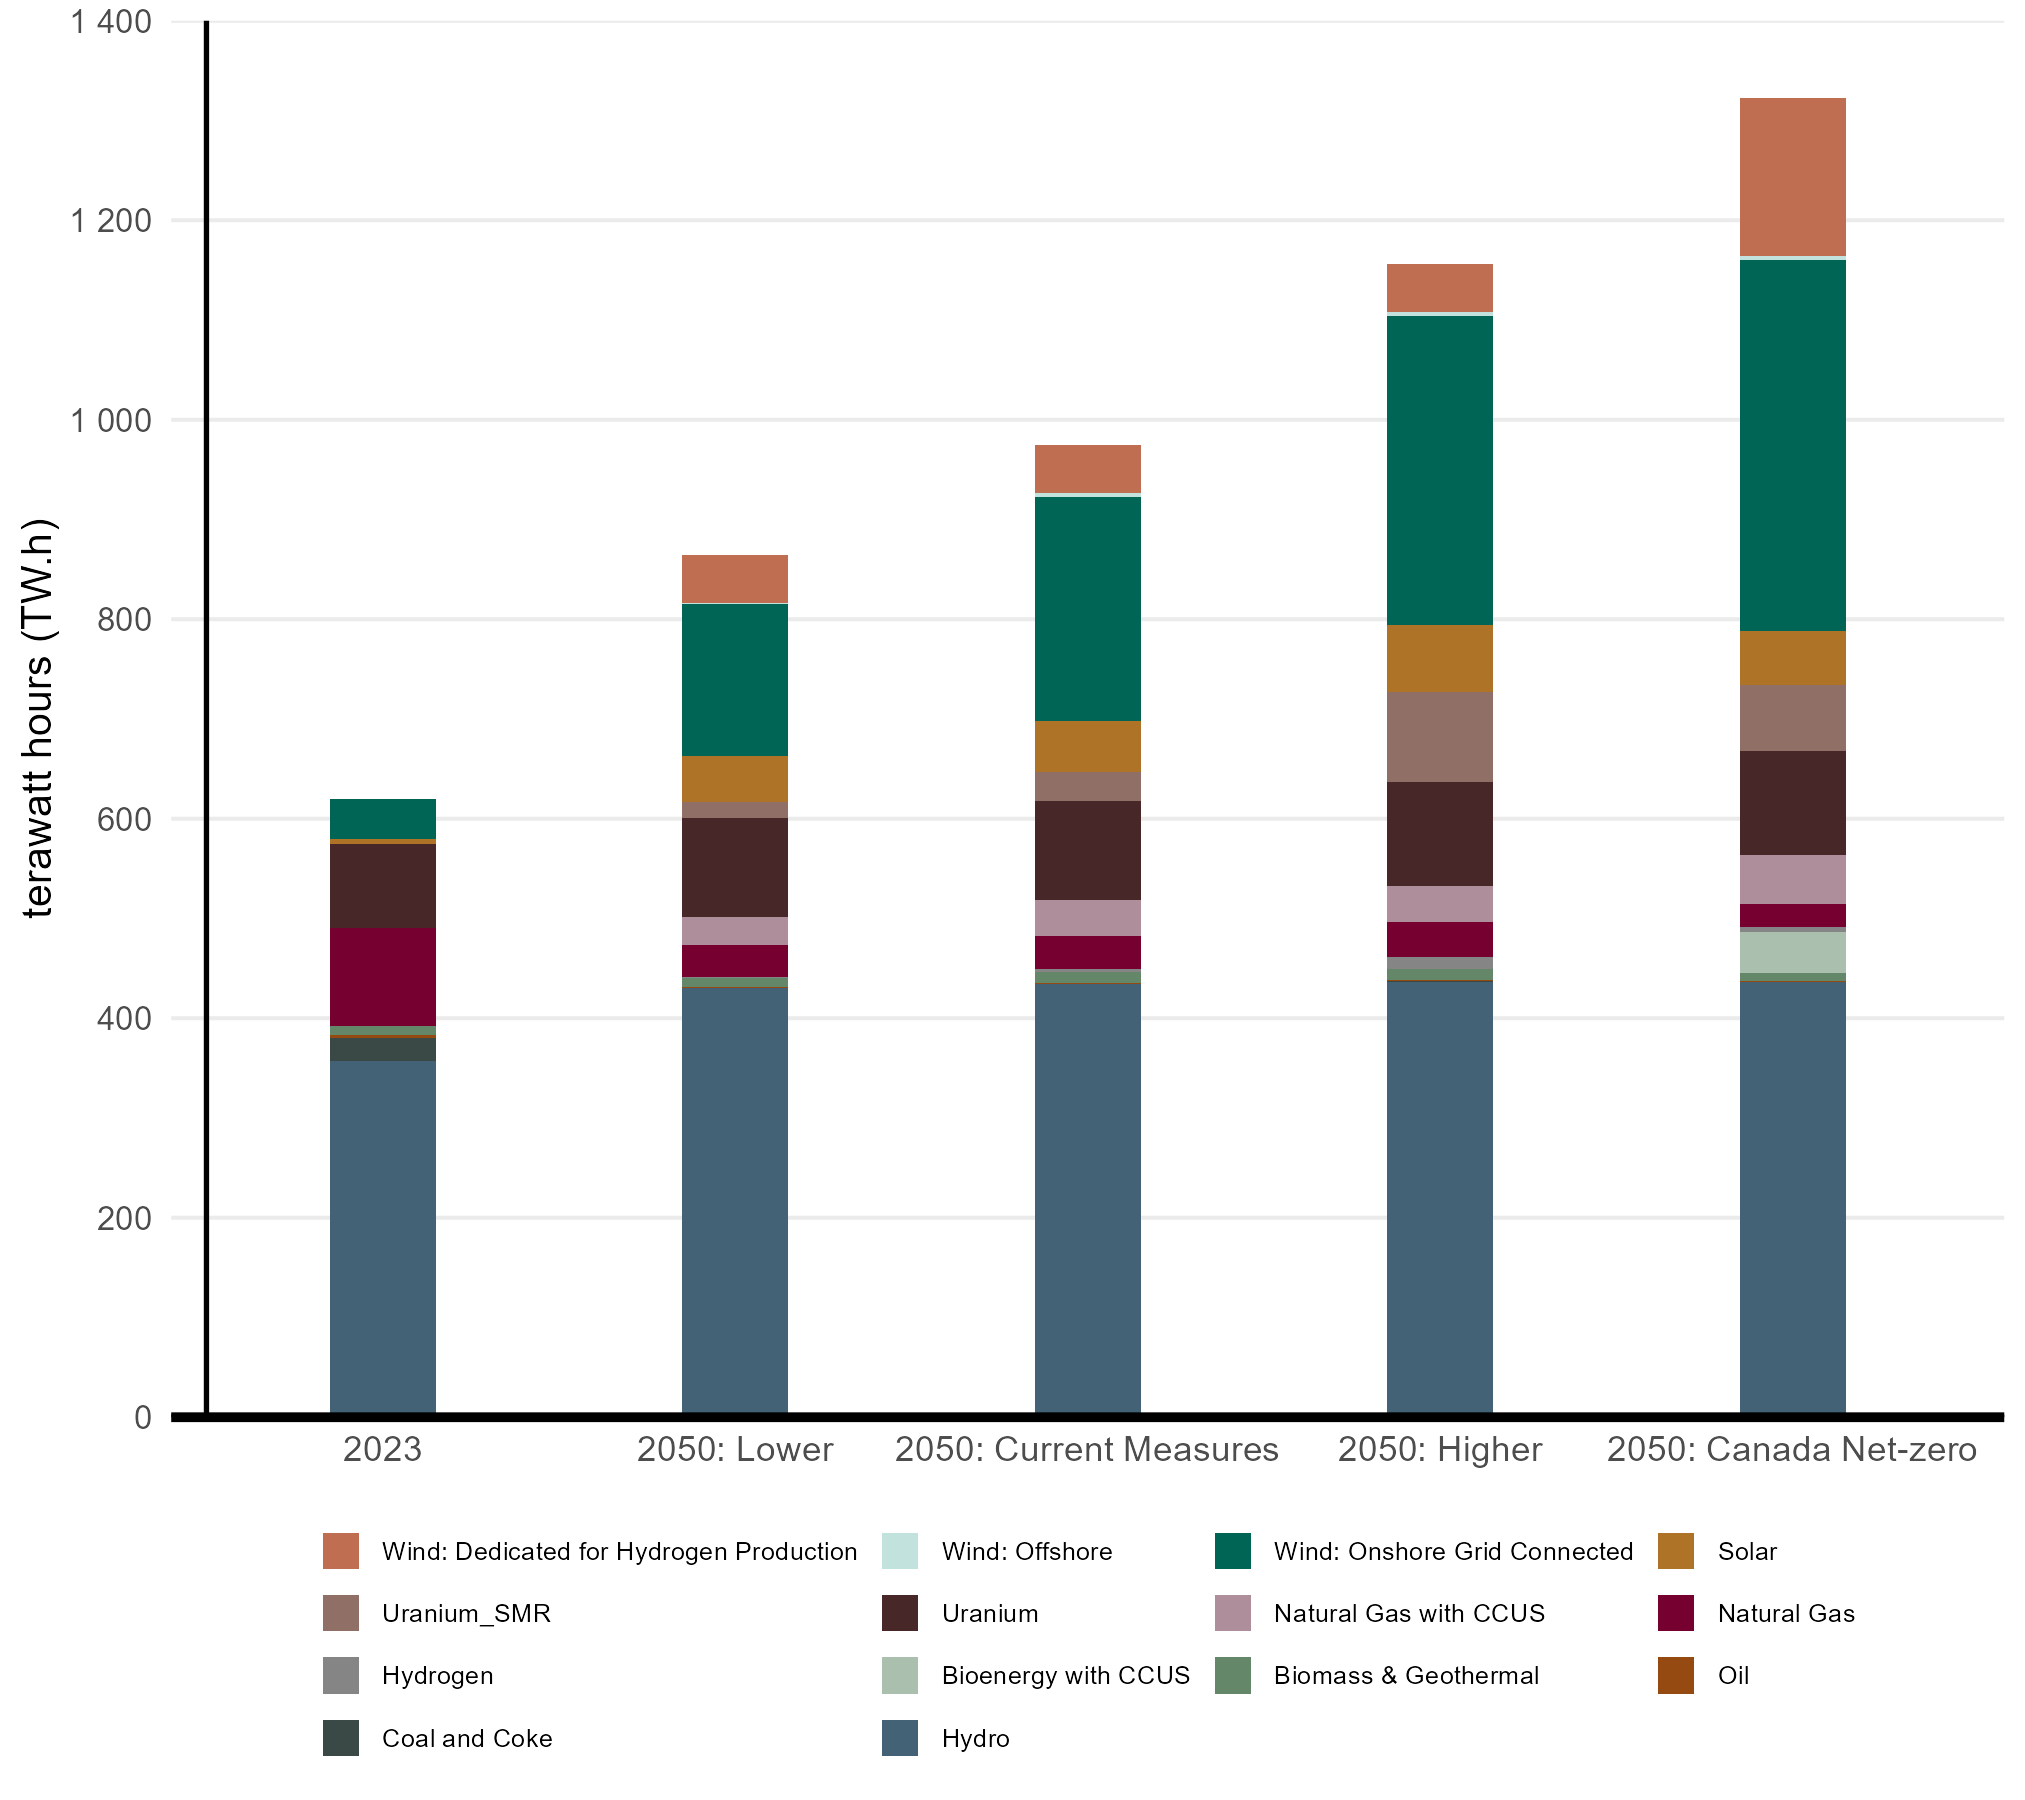
From 2023 to 2050, total electricity generation ranges between an over 30% increase in the Lower scenario to more than doubling in Canada Net-zero. The generation mix also shifts, and by 2050 over 96% of generation comes from low or non-emitting technologies in all scenarios (Figure R.6). In all scenarios, the mix shifts to include much more wind electricity. Wind, which at 40 TWh accounted for 6.5% of generation in 2023, grows to 23% of the mix in the Lower scenario, 28% in Current Measures, 31% in the Higher scenario, and 40% in Canada Net-zero.
Natural gas generation without CCUS falls significantly in all scenarios, even though its capacity remains near or above current levels. In 2023, unabated natural gas accounted for 18% of capacity, and nearly 16% of generation. By 2050, unabated natural gas generation accounts for 11% of capacity in Current Measures, but only accounts for about 3% of generation as it is used sparingly. This signals a shift in role of natural gas from being used primarily for providing on-demand power to ensure system reliability.
Solar generation increases from 7 TWh in 2023 to around 45 to 65 TWh across the scenarios, while hydroelectricity increases by over 50 TWhFootnote 8. Emerging technologies, such as SMR, natural gas with CCUS, and bioenergy with CCUS, also play an important role, especially in Canada Net-zero. Bioenergy with CCUS is a negative emission technology, so its operation offsets emissions for the broader economy in addition to supplying electricity.
What energy sources does your region use to generate electricity?
Discover the data for yourself using our interactive visualization tool. View electricity generation by region.
Text Alternative: This figure shows electricity generation by technology in 2023 and 2050 across all scenarios. Electricity generation is shown as stacked bars, with contributions from hydro, natural gas, natural gas with CCUS, nuclear, wind, solar, bioenergy, hydrogen, and other sources. Total electricity generation is higher in 2050 across all scenarios compared with 2023, with the mix of generation technologies differing across scenarios. Across scenarios, wind generation shows the largest increase by technology.
Meeting electricity demand during extreme events, such as very cold winter periods, poses unique challenges with an increasing share of variable renewables like wind and solar in the projections. Cold weather systems can be associated with prolonged high-pressure conditions, which often bring low wind speeds while simultaneously driving higher electricity demand for heating.
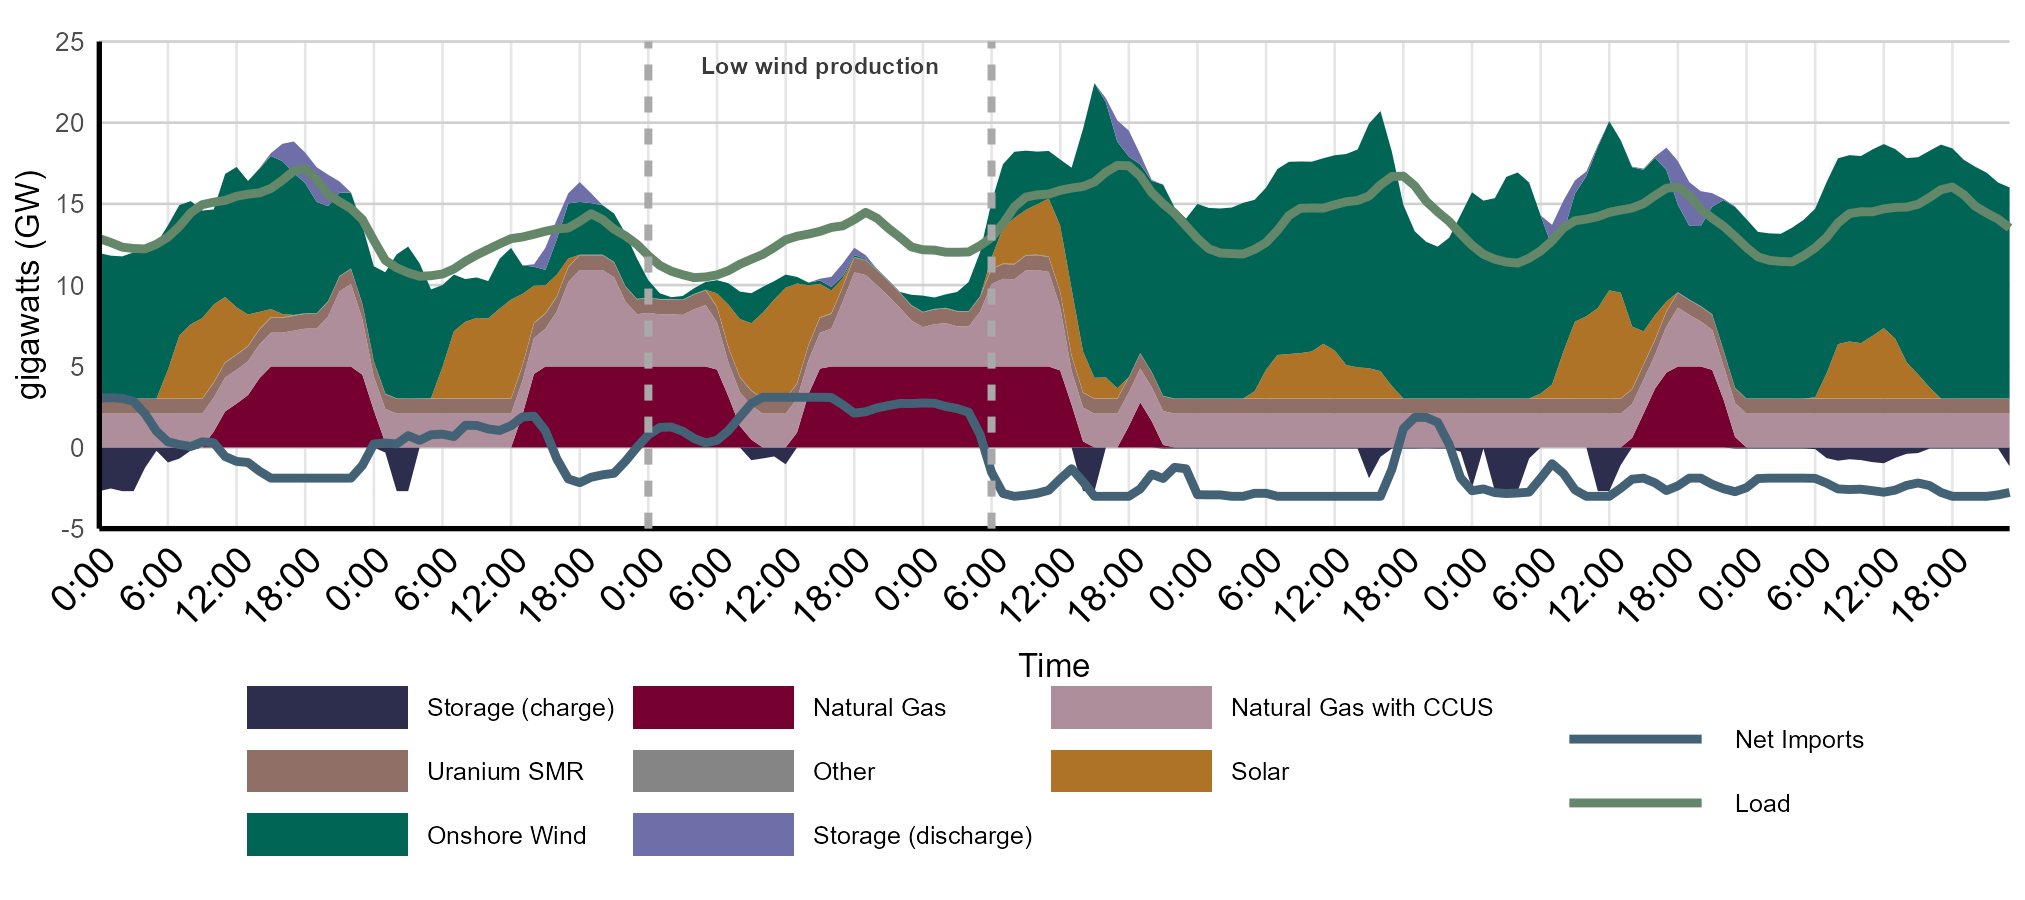
In the projections, these conditions occur only for a relatively small number of hours each year, but systems must still maintain sufficient flexible capacity to ensure reliability during these periods. Figure R.7 presents an example from our hourly electricity modeling for Alberta in 2050 from Current MeasuresFootnote 9. This example shows a cold winter period with constrained wind availability, when wind generation declines from moderate levels to very low output for roughly 30 hours before rebounding to very high production. It is not intended to represent a typical of average week.
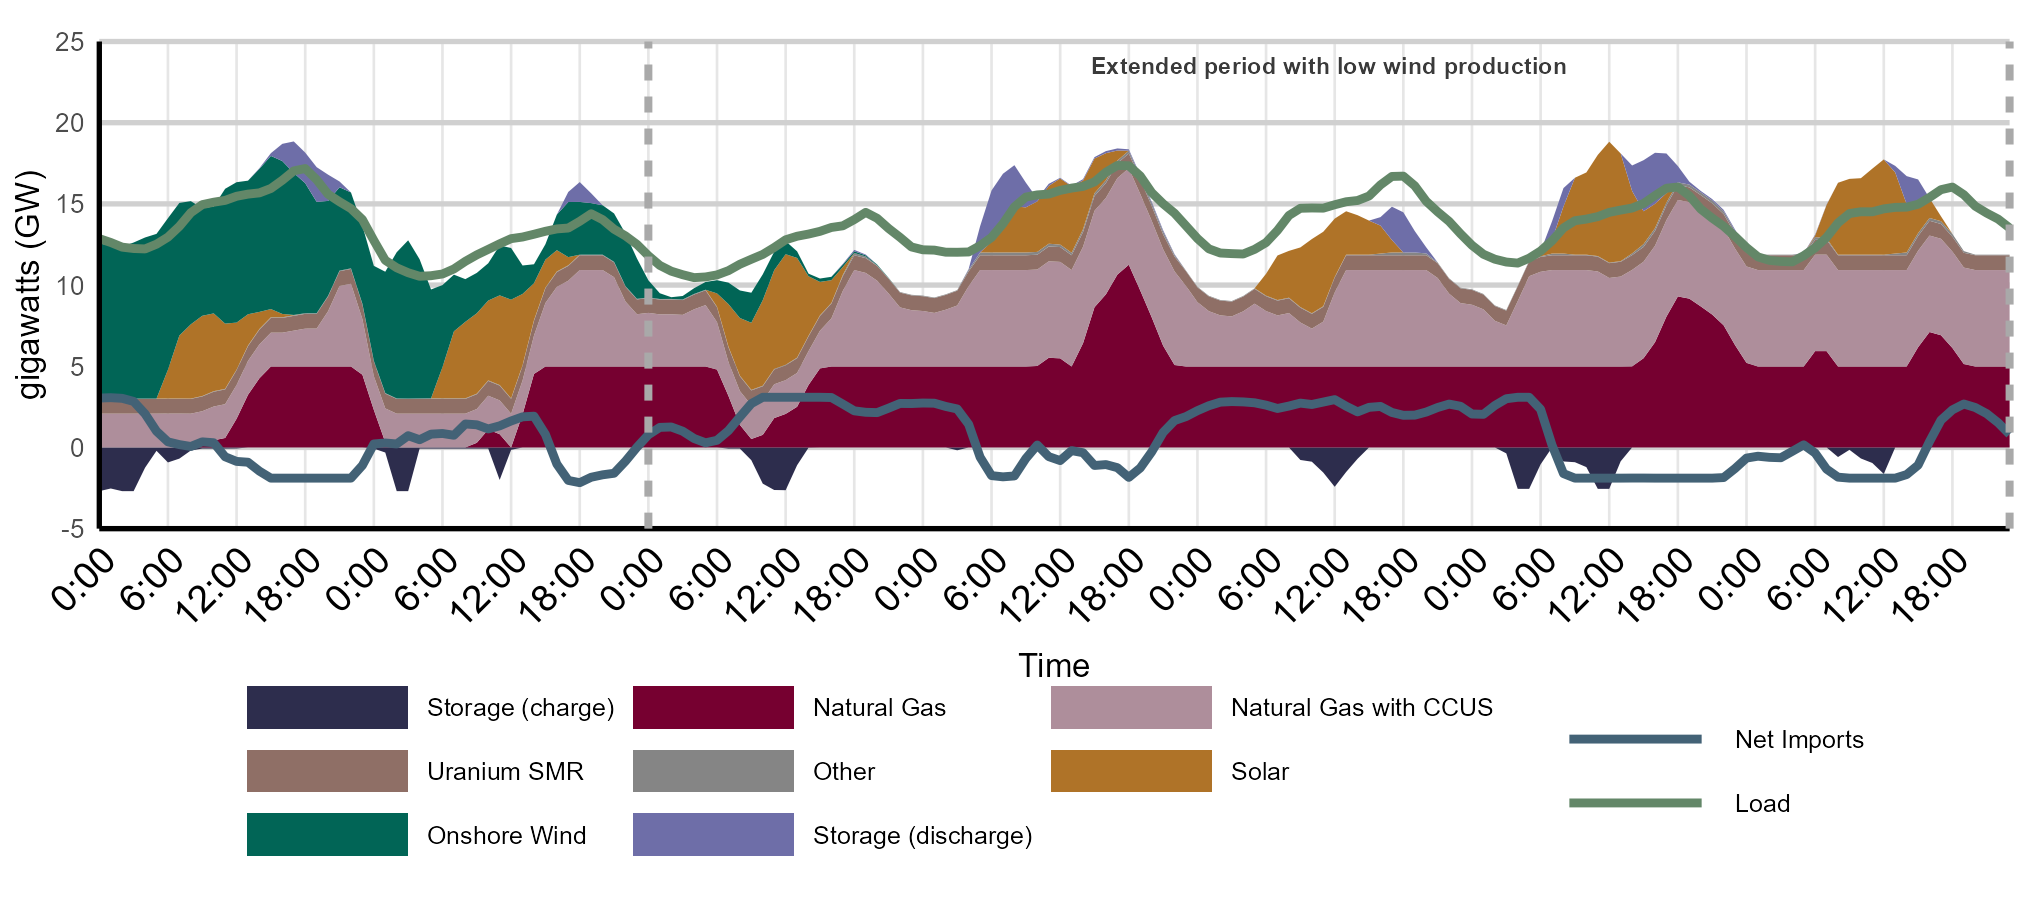
To further explore system resilience, Figure R.8 presents an illustrative stress case applied to the same winter period, but assuming even more severely constrained wind conditions. For Figure R.8, we simulate the grid operation for the same week as in Figure R.7, but with wind generation falling even further, to zero generation and remaining at zero for five days.
Description: This chart shows electricity supply and demand in Alberta over seven consecutive winter days in 2050 in the Current Measures scenario, during an illustrative period with constrained wind availability. Electricity generation is shown by source, alongside system load, storage charging and discharging, and net interprovincial electricity flows. Wind output declines to very low levels for a short period before rebounding to high production, with other resources adjusting to maintain system balance.
Description: This chart shows how Alberta’s electricity system in 2050 under the Current Measures scenario could respond during an illustrative extreme winter period with near-zero wind generation over several consecutive days. In the absence of wind, electricity supply shifts toward other generation sources, increased storage discharge, and net electricity imports, while system load remains similar to the constrained-wind case.
The first example (Figure R.7) shows that when wind output declines, other dispatchable resources increase output to maintain system balance. These resources are primarily natural gas units with and without CCUS. The example also shows that these dispatchable units generate much less during periods of high wind generation, when the province’s generation is dominated by wind and Alberta is a net exporter of electricity.
The simulation with even lower wind (Figure R.8) shows Alberta relying even more heavily on dispatchable generation, storage, and imports to keep the system balanced. Over the simulated week, natural gas units supply about 67% of electricity. Electricity storage and interprovincial interties also play important roles: storage discharge increases by 37% relative to the same week with less extreme conditions (Figure R.7), and Alberta becomes a net importer of electricity from neighbouring provinces, using interties as a source of system flexibility to manage tight supply conditions.
The Clean Electricity Regulations set annual emission limits on the CO2 emissions of fossil fuel generators, and those limits fall to zero in 2050. However, as shown in Figure R.7 and R.8, there is still some unabated natural gas generation in 2050, meaning some direct emissions do occur in this example. This is possible because the Clean Electricity Regulations include compliance flexibility, including the use of offsets, that allow fossil fuel generators to operate for a limited number of hours in 2050 and beyond. These are reflected in the modeled results discussed here.
These examples are based on weather patterns from one historical example year. In practice, extreme cold conditions can vary across years, and some rare events may lead to higher demand simultaneously in multiple provinces, reducing the availability of imports, which play a role in balancing the grid in the examples above. If interprovincial imports are unavailable, other options would need to be utilized. Importantly, our electricity supply modeling does not include large-scale demand-side management (DSM) programs and technologies that can reduce peak load and reduce grid stress. Examples include managed EV charging, time-of-use pricing, and automated demand response for commercial and industrial loads. There is considerable potential for DSM to grow as a grid management tool over the coming decades. As a result, incorporating DSM could further reduce the generation and import requirements compared to what is shown in these examples.
Over time, as wind and solar generation expand, the importance of system flexibility—through back-up dispatchable generation, electricity storage, interprovincial trade, and potentially DSM—continues to grow. This is especially evident in the Canada Net-zero and Higher scenarios, which feature the highest shares of variable renewables. These results highlight the growing role of planning for rare but high-impact extreme weather events.
Across all scenarios, interprovincial trade enabled by transmission interties plays a growing role in balancing variations in electricity supply and demand across provincial systemsFootnote 10. By 2050, total interprovincial transmission capacity increases by roughly 70% in all scenarios, with expansions along nearly all interprovincial corridors.
Interties facilitate transfers between neighbouring provinces under two distinct conditions. First, they help manage periods of low demand or high variable generation (e.g., high wind generation) by enabling provinces with surplus electricity to export to neighbours. Second, they contribute to system balancing during episodes of provincial electricity supply stress, including rare but high impact extreme weather events such as the one described in the previous section “How do the grids of the future respond to extreme weather events?”
In the projections, the total annual interprovincial electricity inflows (and outflows) more than double, rising from 55 TWh in 2023 to 137 TWh by 2050 in the Current Measures scenario, and reaching as high as 140 TWh in the Canada Net zero scenario. Most annual flows occur during more common low demand or high variable generation hours, while contributions during infrequent extreme events remain smaller in volume but essential for reliability.
Analysis of crude oil in this report includes production of bitumen and synthetic crude oil from the oil sands, conventional light and heavy oil, condensate and pentanes plus from natural gas production, and offshore Newfoundland and Labrador oil production.
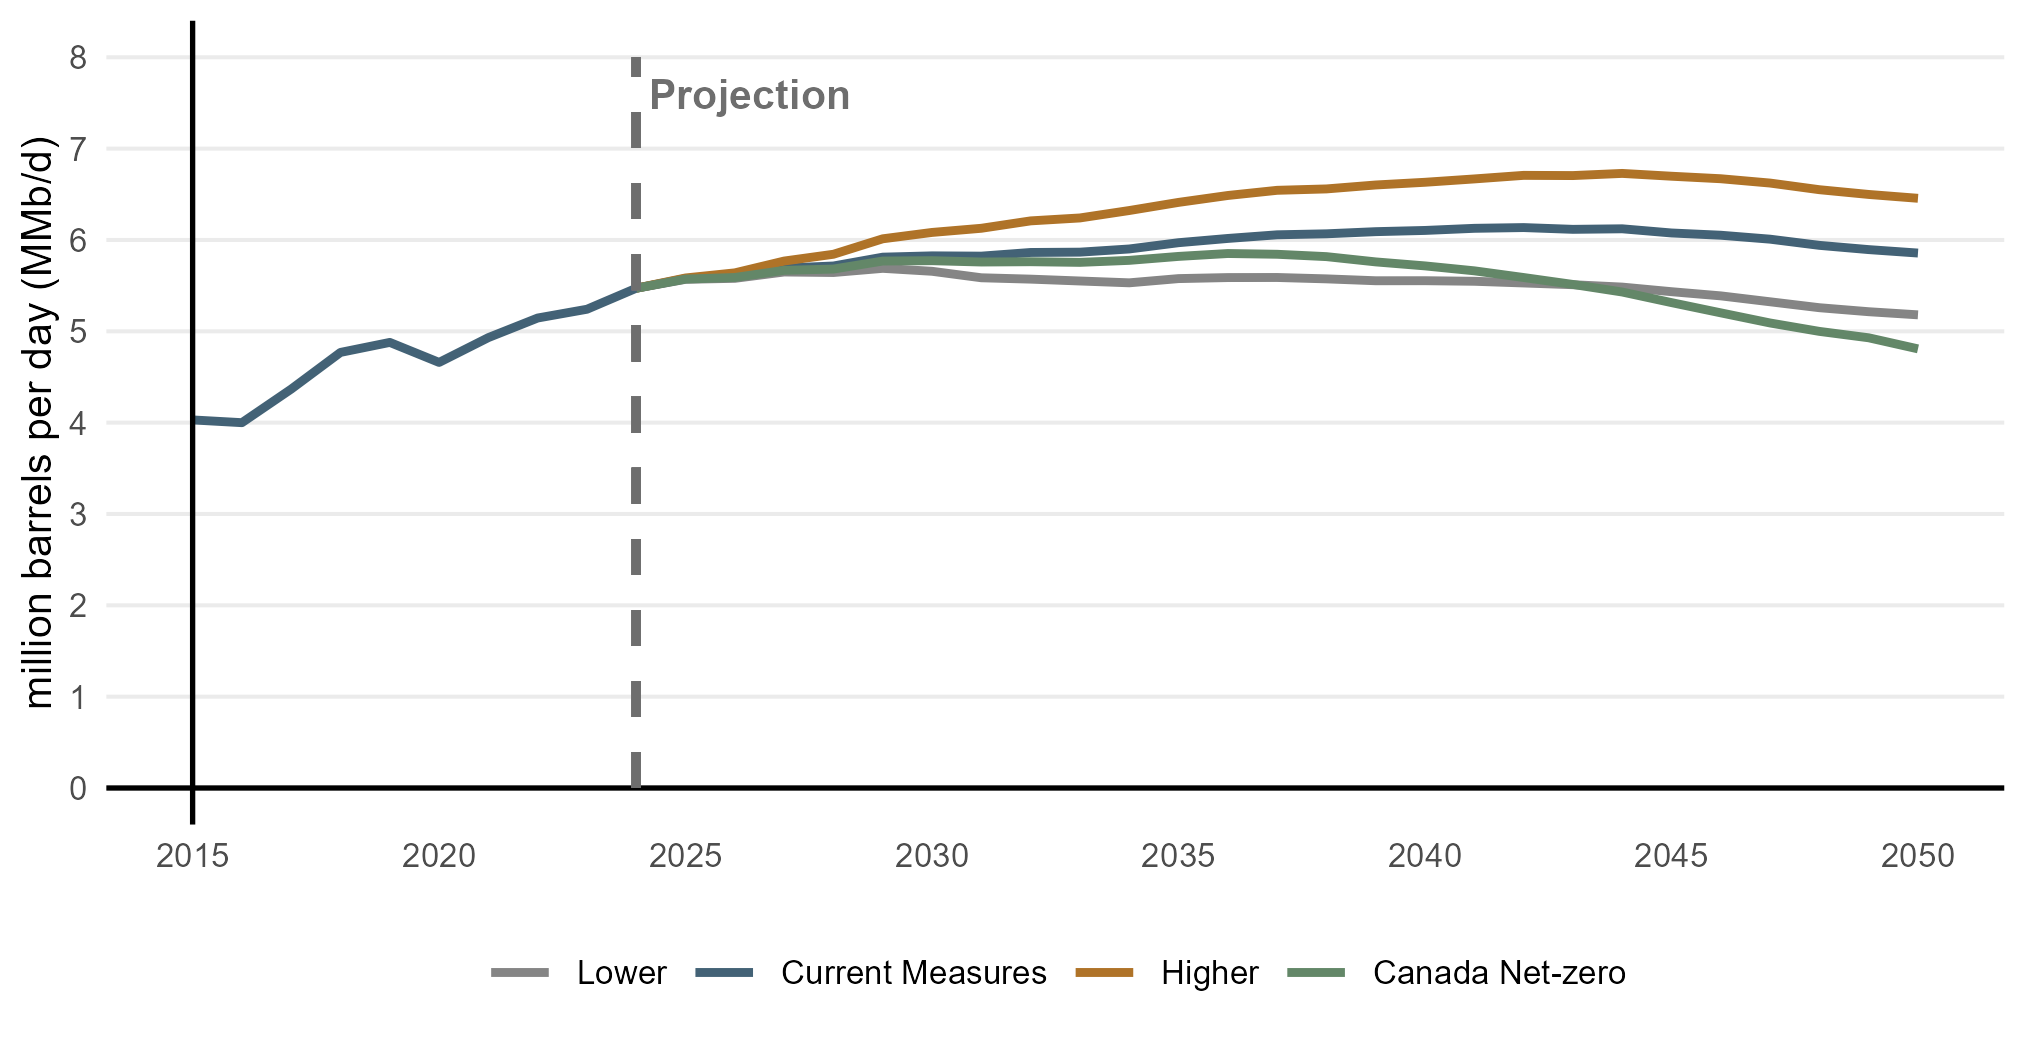
Crude oil production increases in the near term for all scenarios, with longer-term pathways diverging primarily based on the crude oil price assumptions described in the scenarios and Assumptions chapter (Figure R.9). In Current Measures, crude oil production increases to 5.8 MMb/d by 2030 compared to 5.5 MMb/d in 2024, or 6.5%. Production in the Higher scenario is 6.1 MMb/d 2030, a 11% increase from 2024. Production in 2030 is lowest at 5.7 MMb/d in the Lower scenario, driven by low prices.
Over the longer term, production in Current Measures increases, reaching 6.1 MMb/d around 2040, before leveling off to 5.9 MMb/d in 2050. In the Higher scenario, higher prices lead to production peaking at 6.7 MMb/d in the mid-2040s, and trending to 6.5 MMb/d in 2050, 10% higher than in Current Measures. Production in the Lower scenario gradually declines to 5.2 MMb/d by 2050, which is close to 2022 production levels. In Canada Net-zero, we assume global oil prices fall due to falling global demand, and production gradually turns downward as well, reaching similar levels as the Lower scenario by 2050. In Canada Net-zero, production peaks at 5.8MMb/d around 2036 and remains above 5 MMb/d for most of the projection period, even as the industry decarbonizes by reducing methane emissions and using CCUS technology.
How does crude oil production change throughout the projection period?
Discover the data for yourself using our interactive visualization tool. View projected crude oil production.
Text Alternative: This figure shows total crude oil production from 2015 to 2050 across all scenarios. Production rises steadily from 2015 to the mid-2020s, then follows different paths depending on the scenario. The Lower scenario sees production plateauing before 2030 and then declining gradually. In Canada Net-zero, production starts declining in the late 2030s. Current Measures sees production grow until the 2040s and then decline modestly. The Higher scenario sees the largest growth.
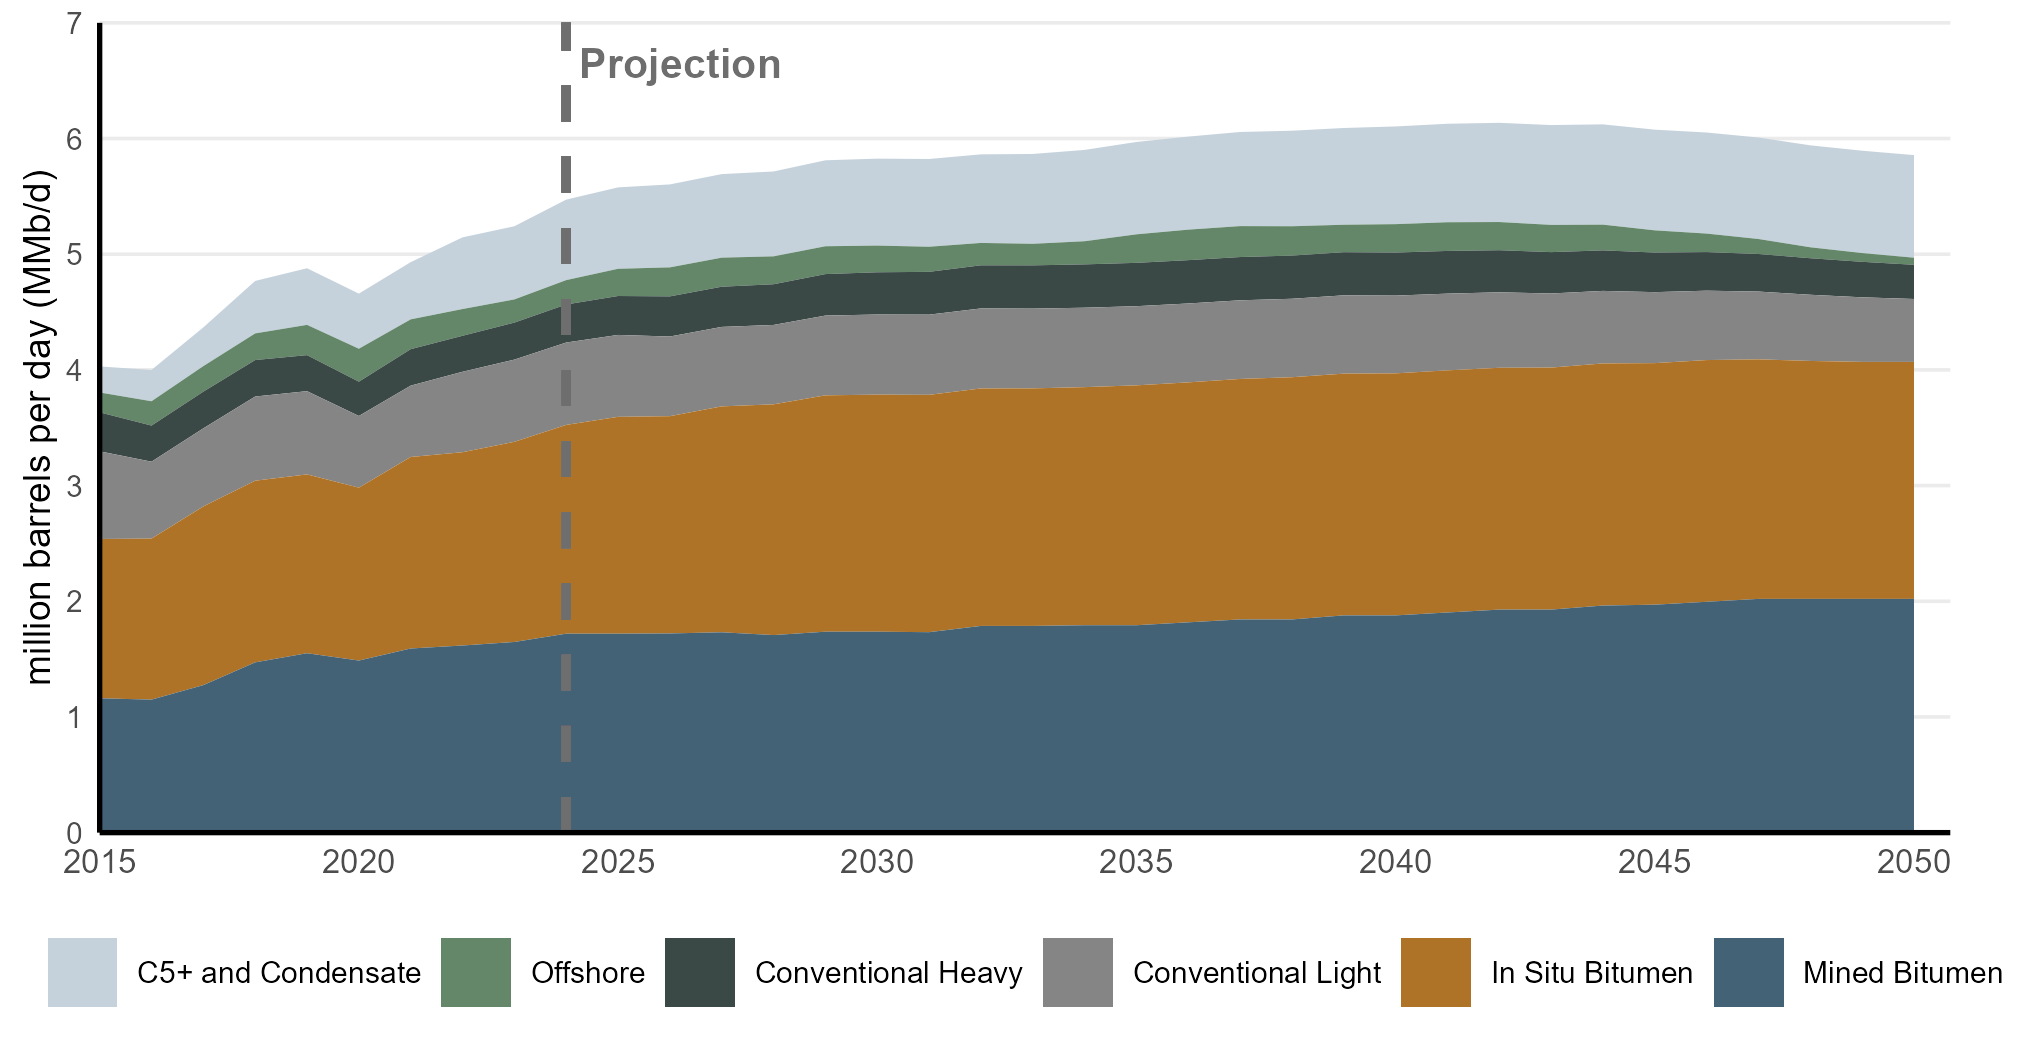
Canadian oil production in Current Measures continues to be dominated by the oil sands, as shown in Figure R.10. Total oil sands production (broken out as Mined Bitumen and In Situ Bitumen in Figure R.10) continues to grow to 2050 in Current Measures, reaching 4.1 MMb/d by 2050. The plateauing and longer-term production declines in total crude oil production are attributed to declines in conventional heavy and light production. Offshore oil production remains relatively stable to the mid-2040s and then declines as aging facilities come offline.
Text Alternative: This figure shows oil production by type in Current Measures. The stacked areas represent different types of oil: in situ bitumen and mined bitumen (the two oil sands categories) make up the largest shares across the projection period, making up most of the growth of production overtime. C5+/Condensate also sees significant growth, though starting from a lower starting point. Offshore oil production, which is often included in the Conventional Light and Heavy categories, is separated out for clarity. Conventional Light and Heavy in this chart refer to on-shore production only. Total oil production rises gradually to the early 2030s, then remains relatively stable before declining slightly toward 2050.
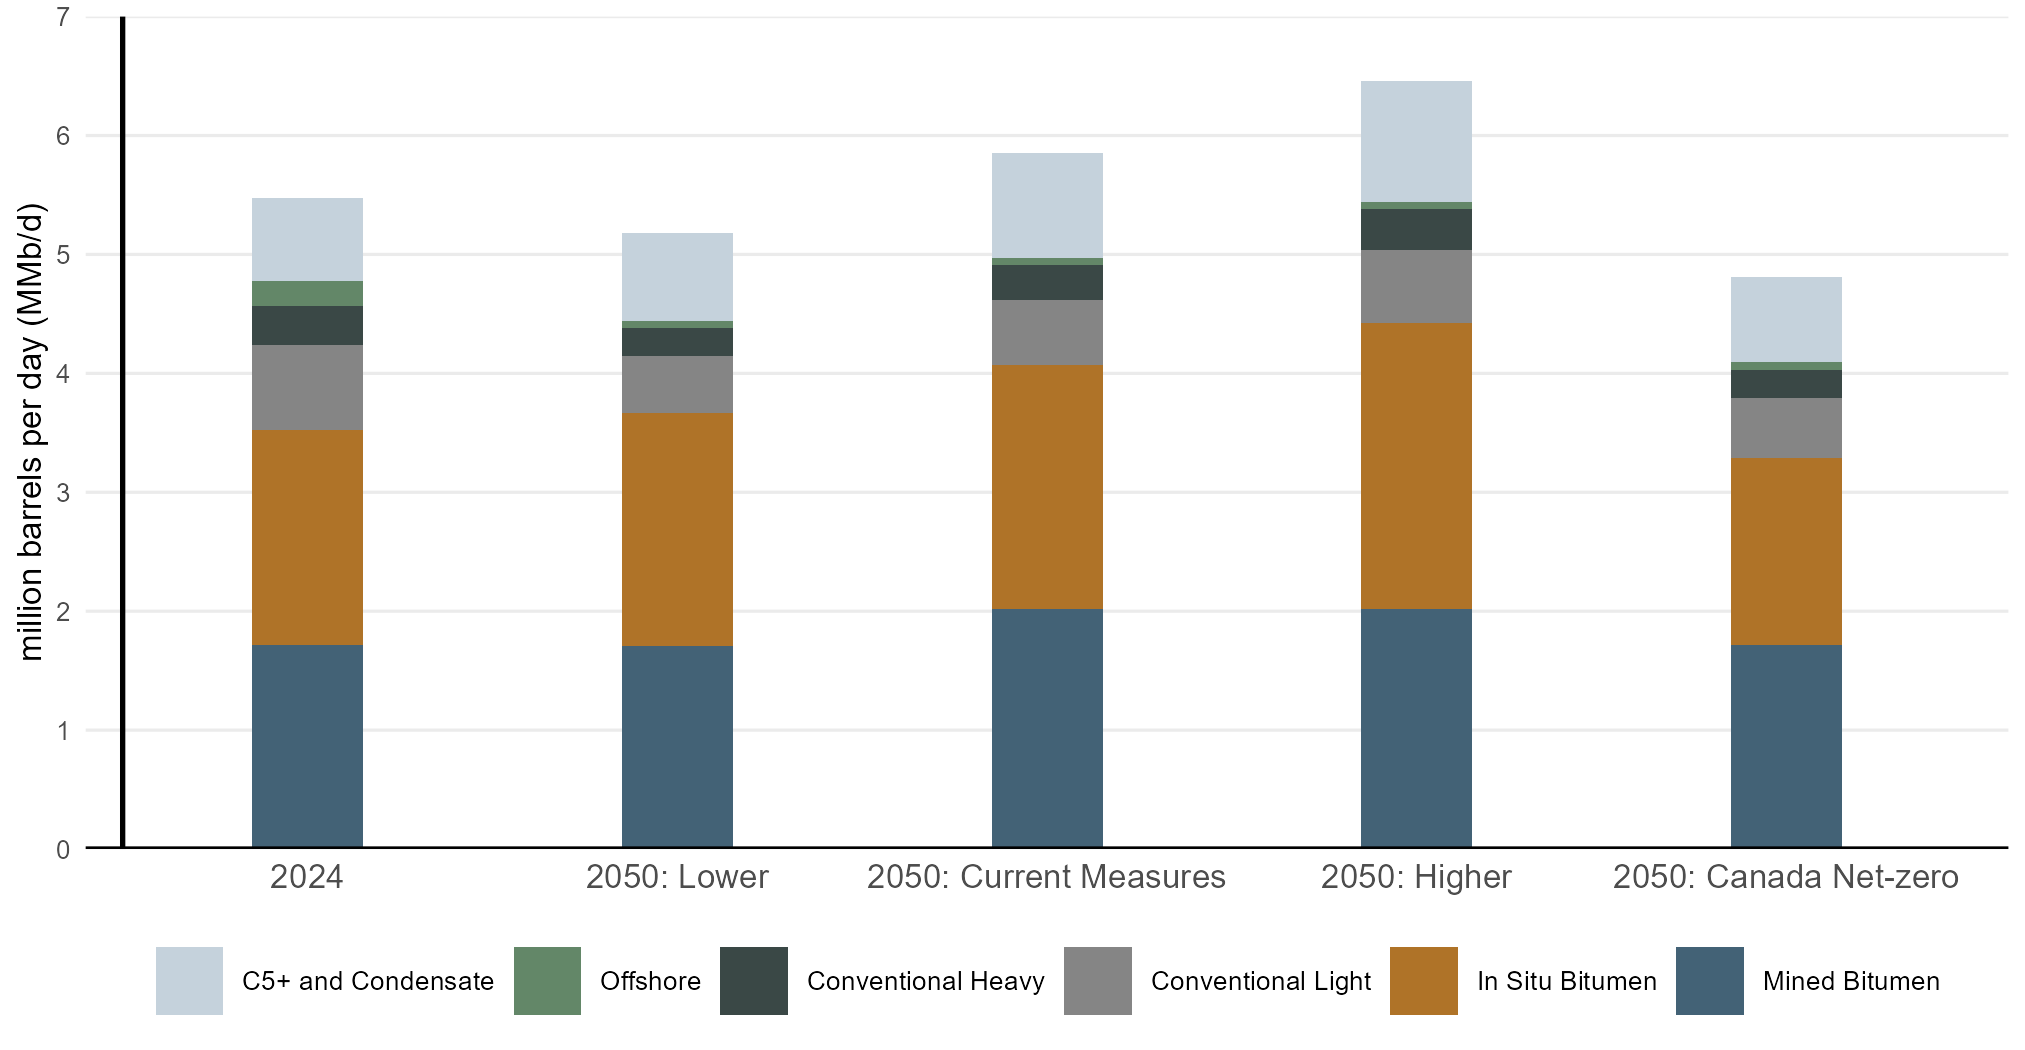
Oil sands production makes up the majority of production in all scenarios (Figure R.11). In 2050, conventional light, heavy, and offshore production is lower than 2024 levels. In the Higher scenario, production is over 6.5 MMb/d in 2050, largely driven by a 900 Mb/d increase in oil sands production from 2024 levels. Even in the lower production scenarios, oil sands production remains near 2024 levels by 2050. Longer term declines in the scenarios are driven by declining production in conventional light and heavy oil, to varying degrees.
Text Alternative: This figure compares oil production by type in 2024 and 2050 across all scenarios. Each colour represents a different oil type: conventional light, conventional heavy, offshore, C5+/condensate, mined bitumen, and in situ bitumen. The first bar in each group shows historical 2024 production, followed by projected 2050 values for each scenario. Conventional light and heavy both see a decline across all scenarios. C5+/condensate and mined bitumen remain similar in 2050 as in 2024, with slightly higher production in Current Measures and the Higher scenario. In 2050, in situ and mined bitumen make up the majority of production in all scenarios.
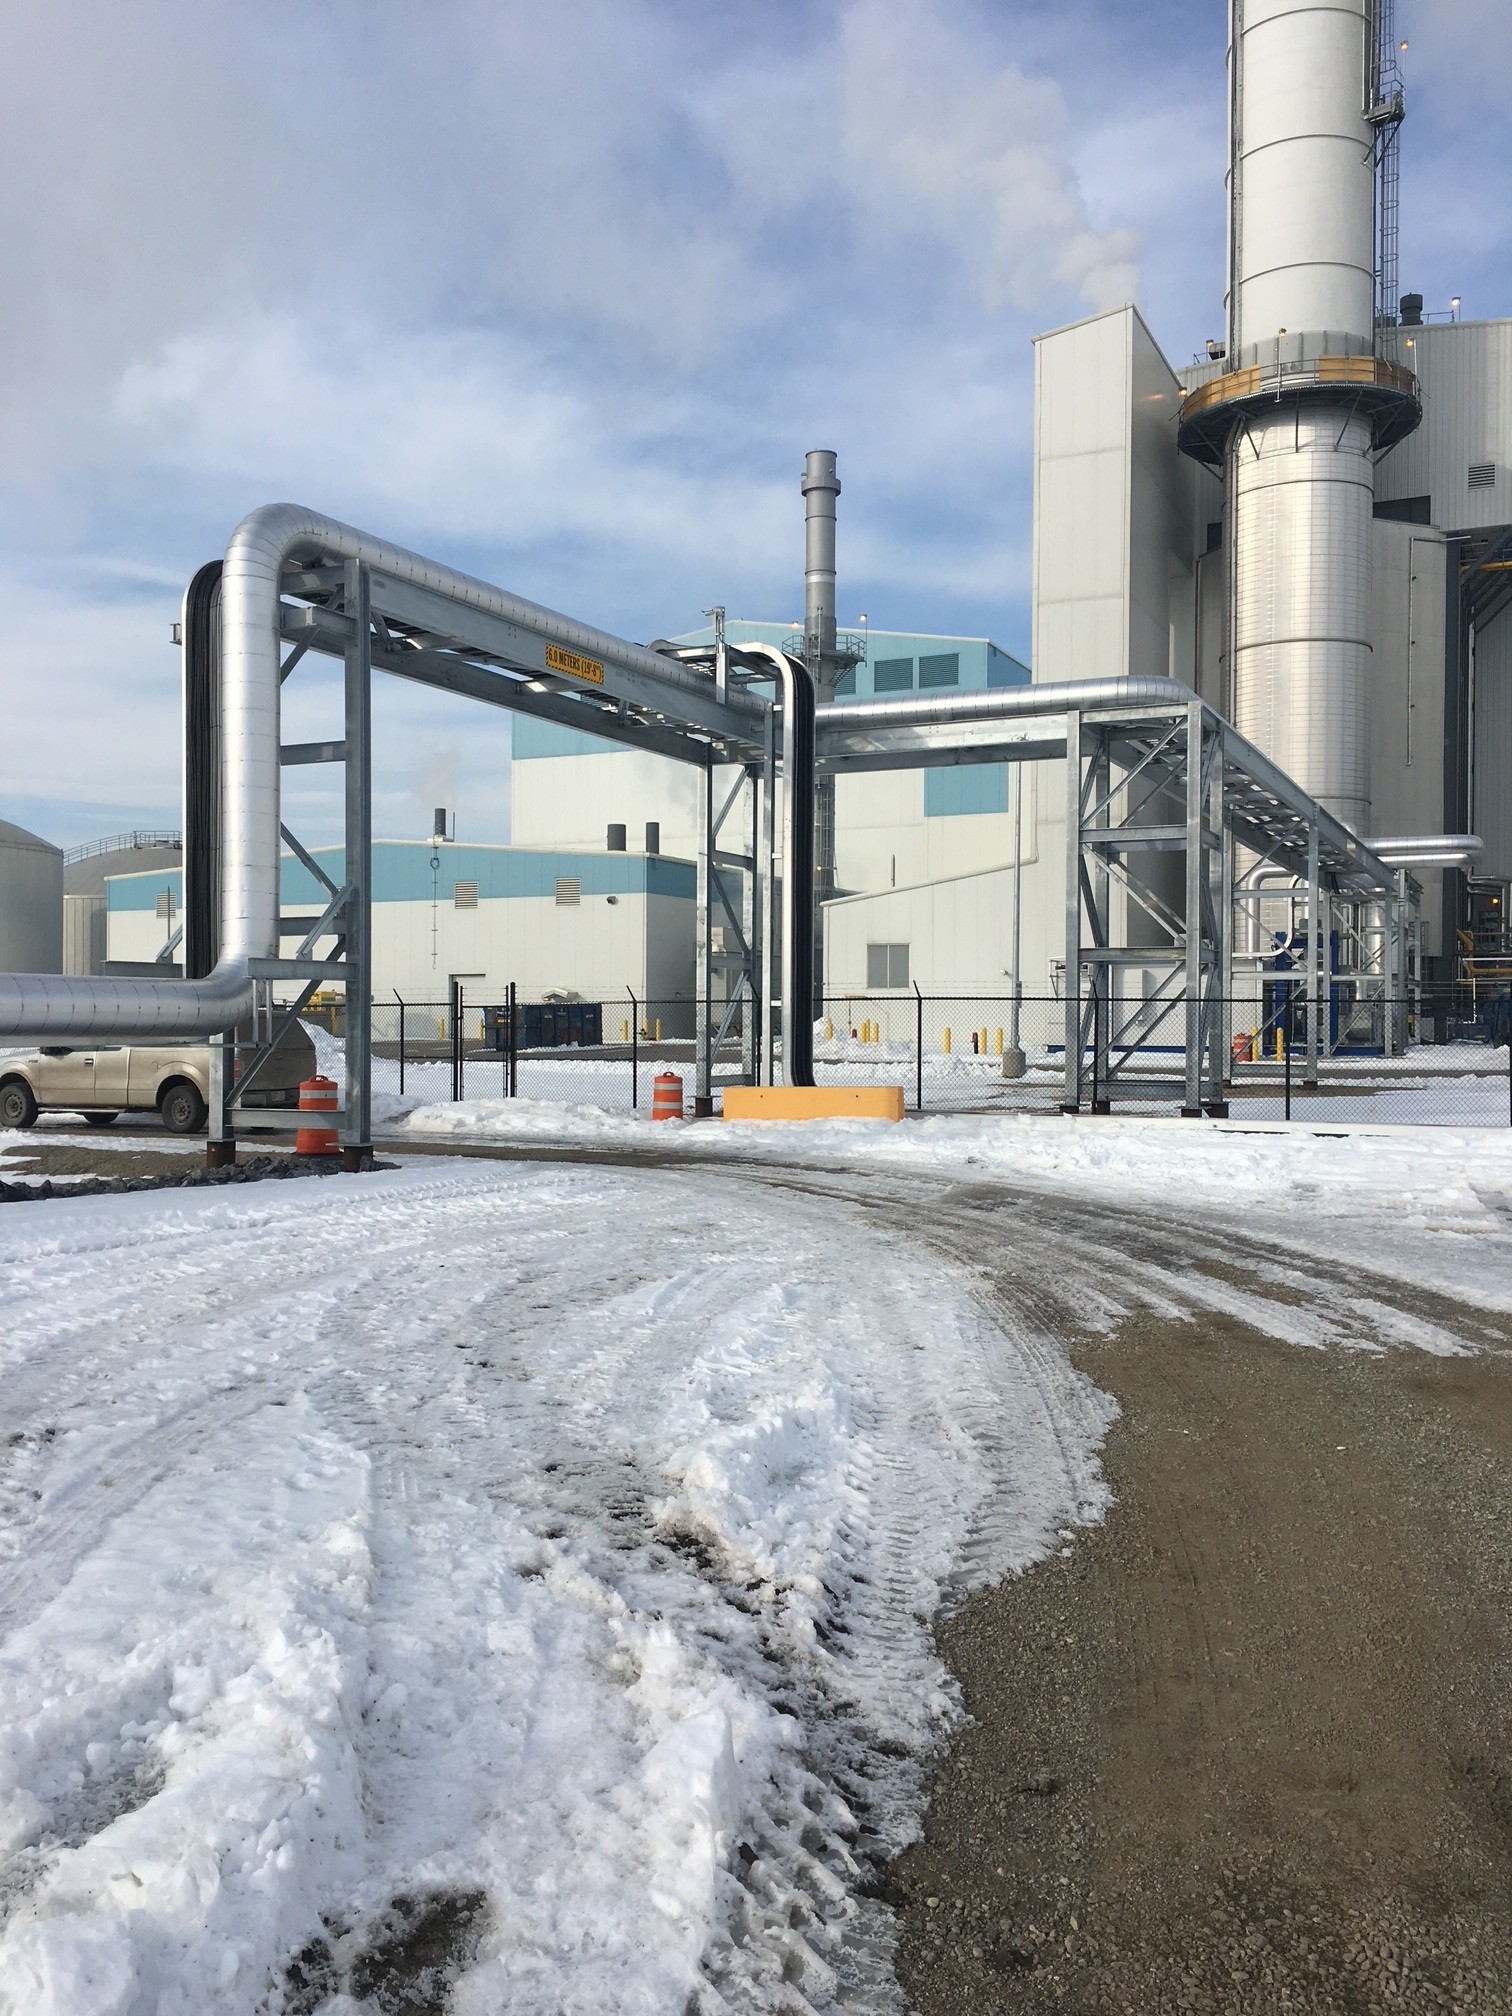
Alberta Carbon Conversion Technology Centre, Photo credit: InnoTech Alberta
Technology costs are a major uncertainty in long-term energy outlooks. In Canada Net-zero, oil production, which is largely driven by the oil sands, declines from today but remains relatively close to recent historical volumes. A key reason for this relatively strong production in a net-zero context is the availability of technological pathways to lower emissions, coupled with an assumed oil price that is greater than $60 per barrel (2025 US$Footnote 11) for most projection years. For the oil sands, much of this hinges on the economics of deploying CCUS at scale. In short, the less expensive it is to adopt new technology, the more likely it is to be adopted. This allows producers to continue operating while reducing emissions in line with an economy-wide transition to net-zero.
Our CCUS assumptions play an important role in how much of the technology is adopted in our scenarios, and therefore on our overall oil production projections. Because CCUS remains an emerging technology with highly uncertain future costs, we developed a High Cost CCUS sensitivity case. This sensitivity case starts with the same assumptions as Canada Net-zero but applies significantly higher CCUS costs to oil sands operations and re-runs the oil sands production model. It provides an illustrative view of how production might evolve in such a scenario if CCUS is more expensive for the oil sands sector.
Table R.1 compares CCUS cost assumptions in Canada Net-zero and the High Cost CCUS sensitivity case. In the High Cost CCUS sensitivity case, CCUS costs are assumed to be about double the values we assume in Canada Net-zero.
| 2030 | 2050 | |||||
|---|---|---|---|---|---|---|
| 2025$ CAD per tonne (before tax credits) | ||||||
| CCUS facilities in: | Steam Generation | Cogeneration | Upgrading | Steam Generation | Cogeneration | Upgrading |
| Canada Net-zero scenario | 250 | 300 | 150 | 190 | 225 | 110 |
| High CCUS Cost sensitivity case | 500 | 600 | 300 | 300 | 450 | 240 |
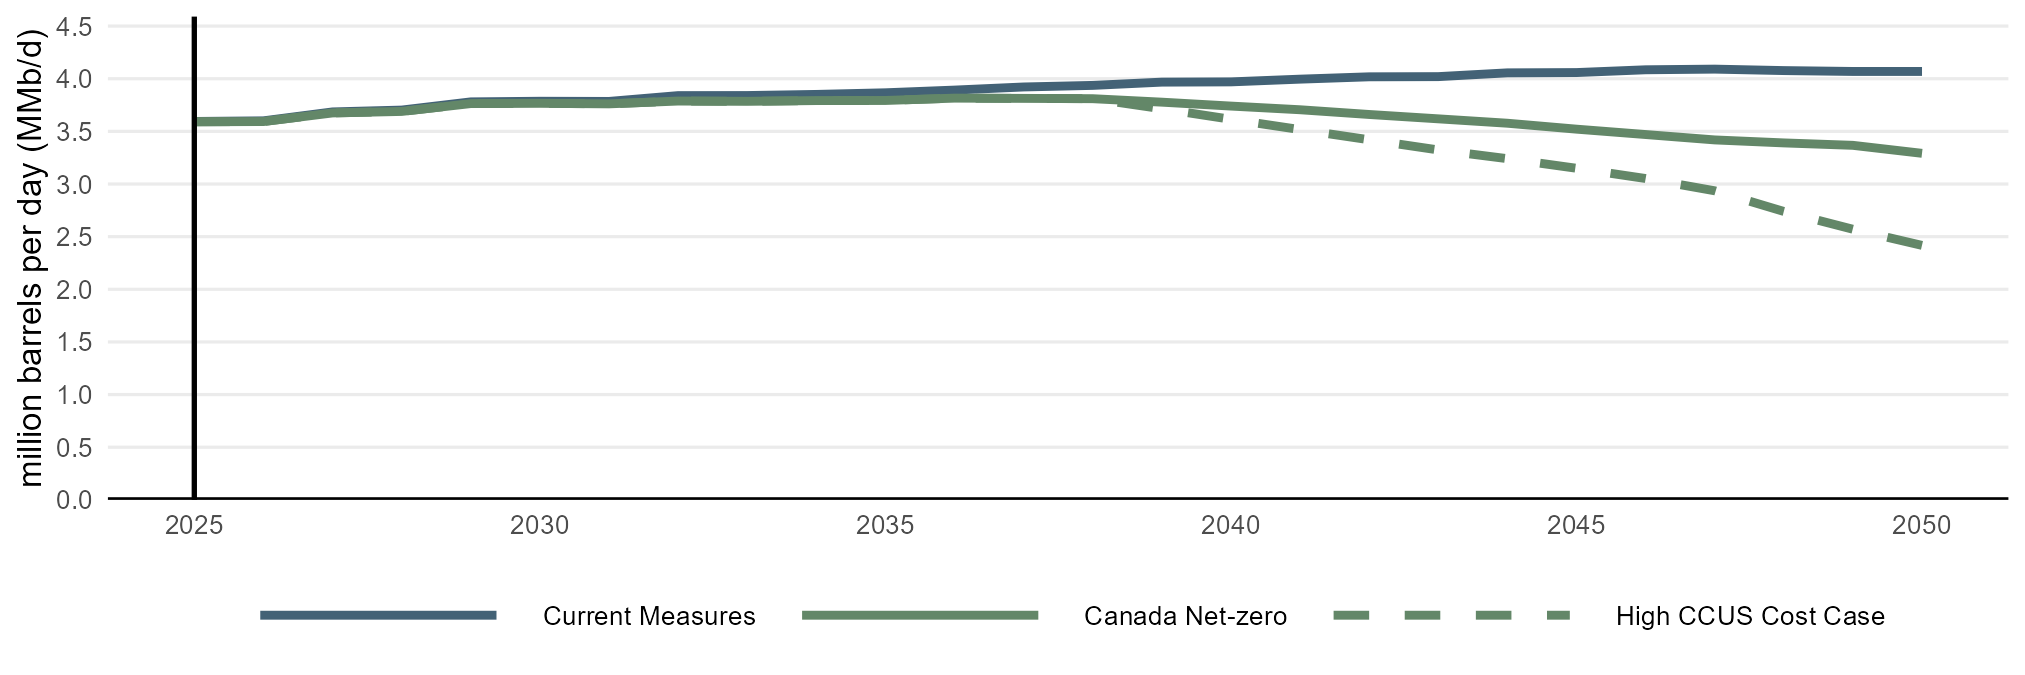
In Canada Net-zero, oil sands production is 3.3 MMb/d by 2050, with 40 MT of carbon dioxide (CO2) stored with CCUS. In the High CCUS Cost sensitivity case, 25% less CCUS is used in the sector, leading to 30 MT of CO2 stored in 2050. Faced with higher CCUS costs, our model shows oil sands producers increasingly choosing to shut down production instead of applying more costly CCUS or other, more expensive decarbonization options. In the High CCUS Cost sensitivity case, oil sands production trends over 25% lower than Canada Net-zero by 2050 at 2.4 MMb/d (Figure R.12). By 2050, oil sands production in the High CCUS Cost sensitivity case is 40% lower than Current Measures.
Description: This figure shows oil sands production in Current Measures, Canada Net-zero, and the High CCUS Cost sensitivity case from 2025 to 2050. In Current Measures, production increases gradually through the mid-2040s and then remains relatively flat. In Canada Net-zero, production peaks in the mid-2030s and then declines steadily starting in the late 2030s. In the High CCUS Cost sensitivity case, production initially follows the Canada Net-zero trend but begins to fall more sharply starting in the late 2030s. By 2050, production in the High CCUS Cost sensitivity case is well below both Canada Net-zero and Current Measures.
This sensitivity analysis is not a fully modeled scenario. Relatively higher costs of CCUS in the oil sands, and changes in production and technology trends, could have implications throughout the economy and energy system which are not covered in this narrow sensitivity analysis.Footnote 12 The High CCUS Cost sensitivity case is valuable in highlighting the importance and sensitivity of our underlying assumptions on the results, and illustrates how sensitive outcomes can be on individual variables.

Developing the Canada’s Energy Future oil and natural gas production outlooks involves integrating the stated assumptions of each scenario with other factors that are less well defined but play an important role in building the projections. These factors are generally related to corporate behavior and external uncertainty, and can interact with the effects of other assumptions, like high oil prices, to influence production growth. Should producer and investor behaviour change in the future, production growth could be meaningfully higher or lower than the scenarios in this report project, even under similar price assumptions. Some of the less discussed, but important complexities, of production modeling include:
New, large-scale oil projects, especially in the oil sands, can take several years to build and have life spans measured in decades, making them sensitive to uncertainties and driving unexpected results if only considering headline assumptions like commodity prices. As with any assumption made in this type of study, future producer and investor behaviour could once again change and drive oil production results materially higher or lower than shown across the Canada's Energy Future scenarios.
Key drivers for natural gas production include North American natural gas prices, which determine the profitability of drilling new wells, and assumptions on LNG exports, described in the Scenarios and Assumptions chapter.
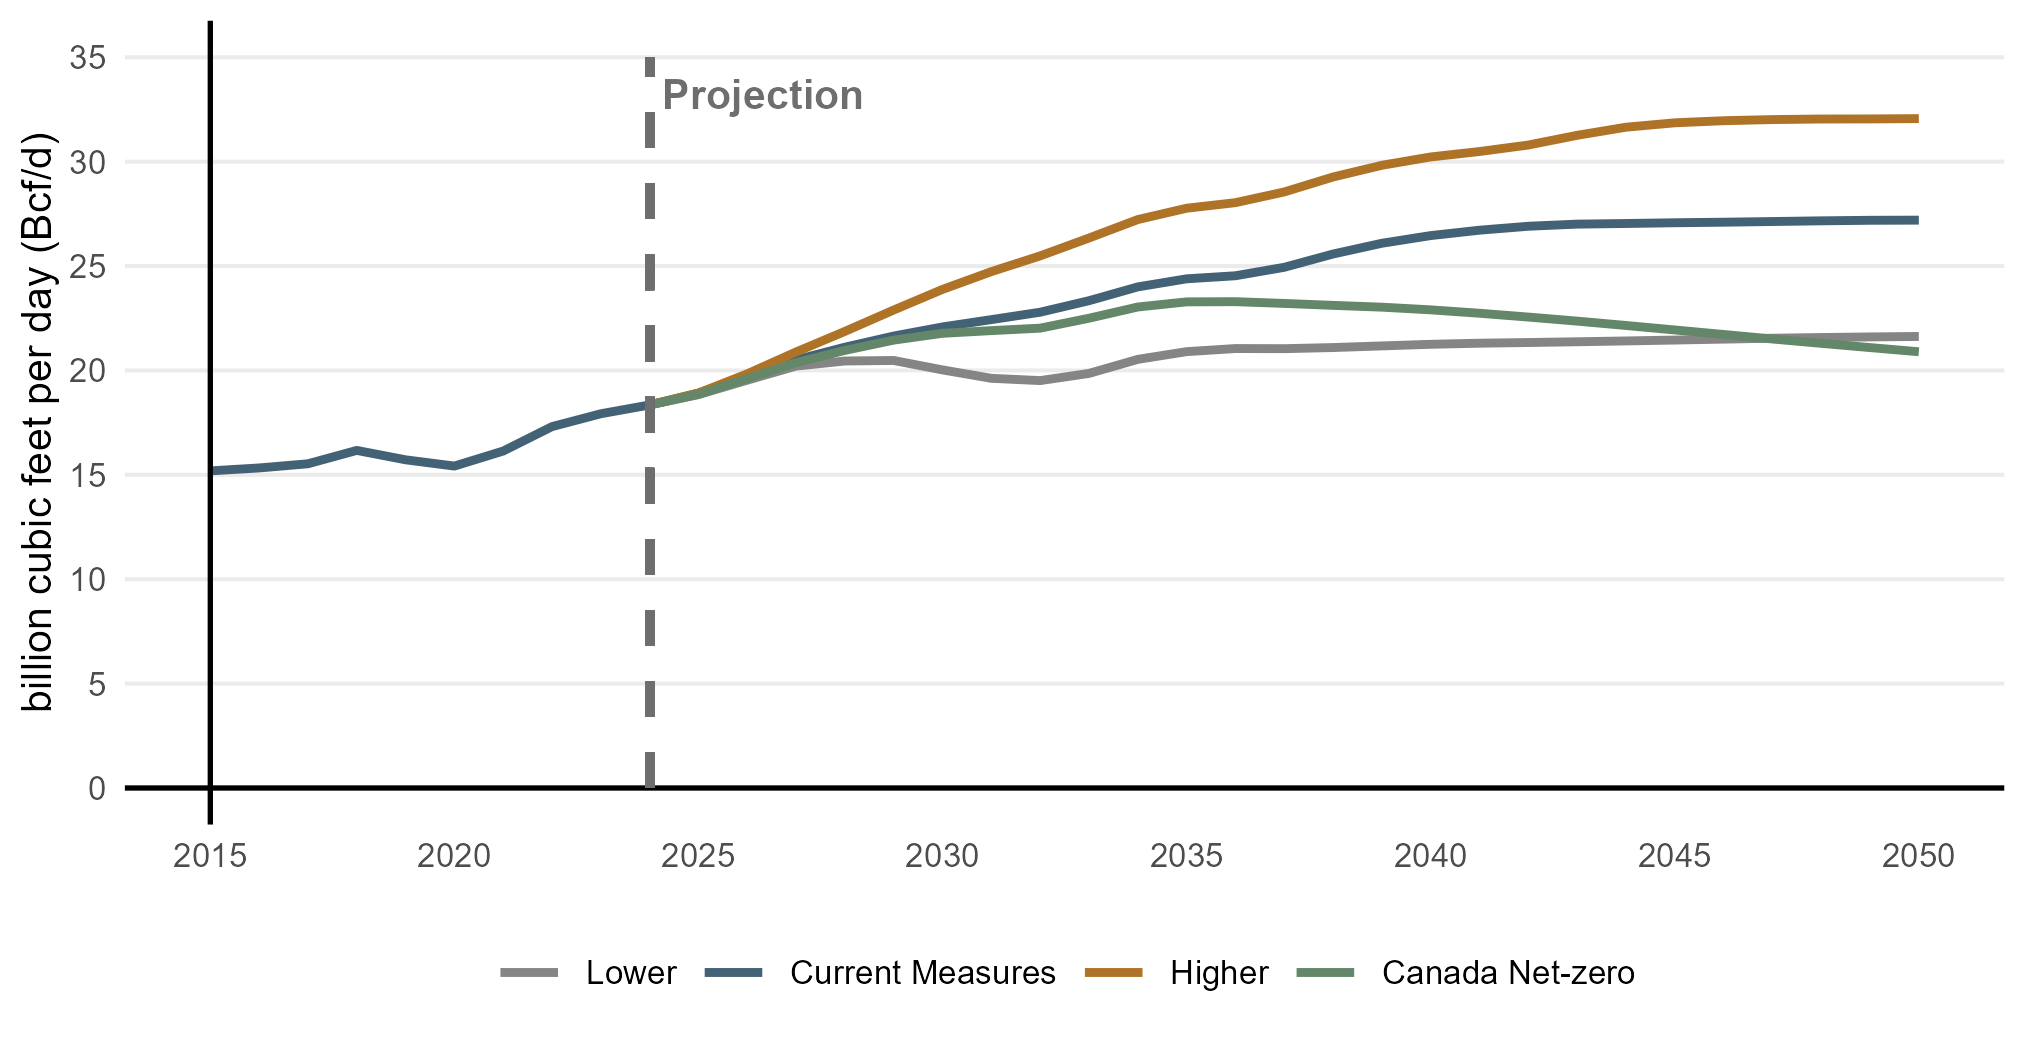
In recent years, Canadian natural gas production increased rapidly from 15.7 Bcf/d in 2019 to a record high of 18.3 Bcf/d in 2024. Growth continues in all our scenarios, to varying degrees (Figure R.13). In 2035, production ranges between 2 to 9 Bcf/d higher than 2024 levels. Over the longer term, Current Measures and the Higher scenarios trend to 27 Bcf/d and 32 Bcf/d in 2050, respectively. Growth is limited in the Lower scenario and Canada Net-zero, which eventually decline to around 21 Bcf/d in 2050, which is still higher than 2024 levels.
Text Alternative: This figure shows total natural gas production from 2015 to 2050 across all scenarios. Production increases gradually from 2015 through the late 2020s, then diverges by scenario. The Higher scenario reaches the highest production level, 32 Bcf/d in 2050. Current Measures show a similar trajectory, but with lower volumes across the projection period. In Canada Net-zero, production reaches 23 Bcf/d in 2036, followed by a modest decline. In the Lower scenario, production peaks in the mid-to-late 2020s, and remains relatively flat for the rest of the projection period.
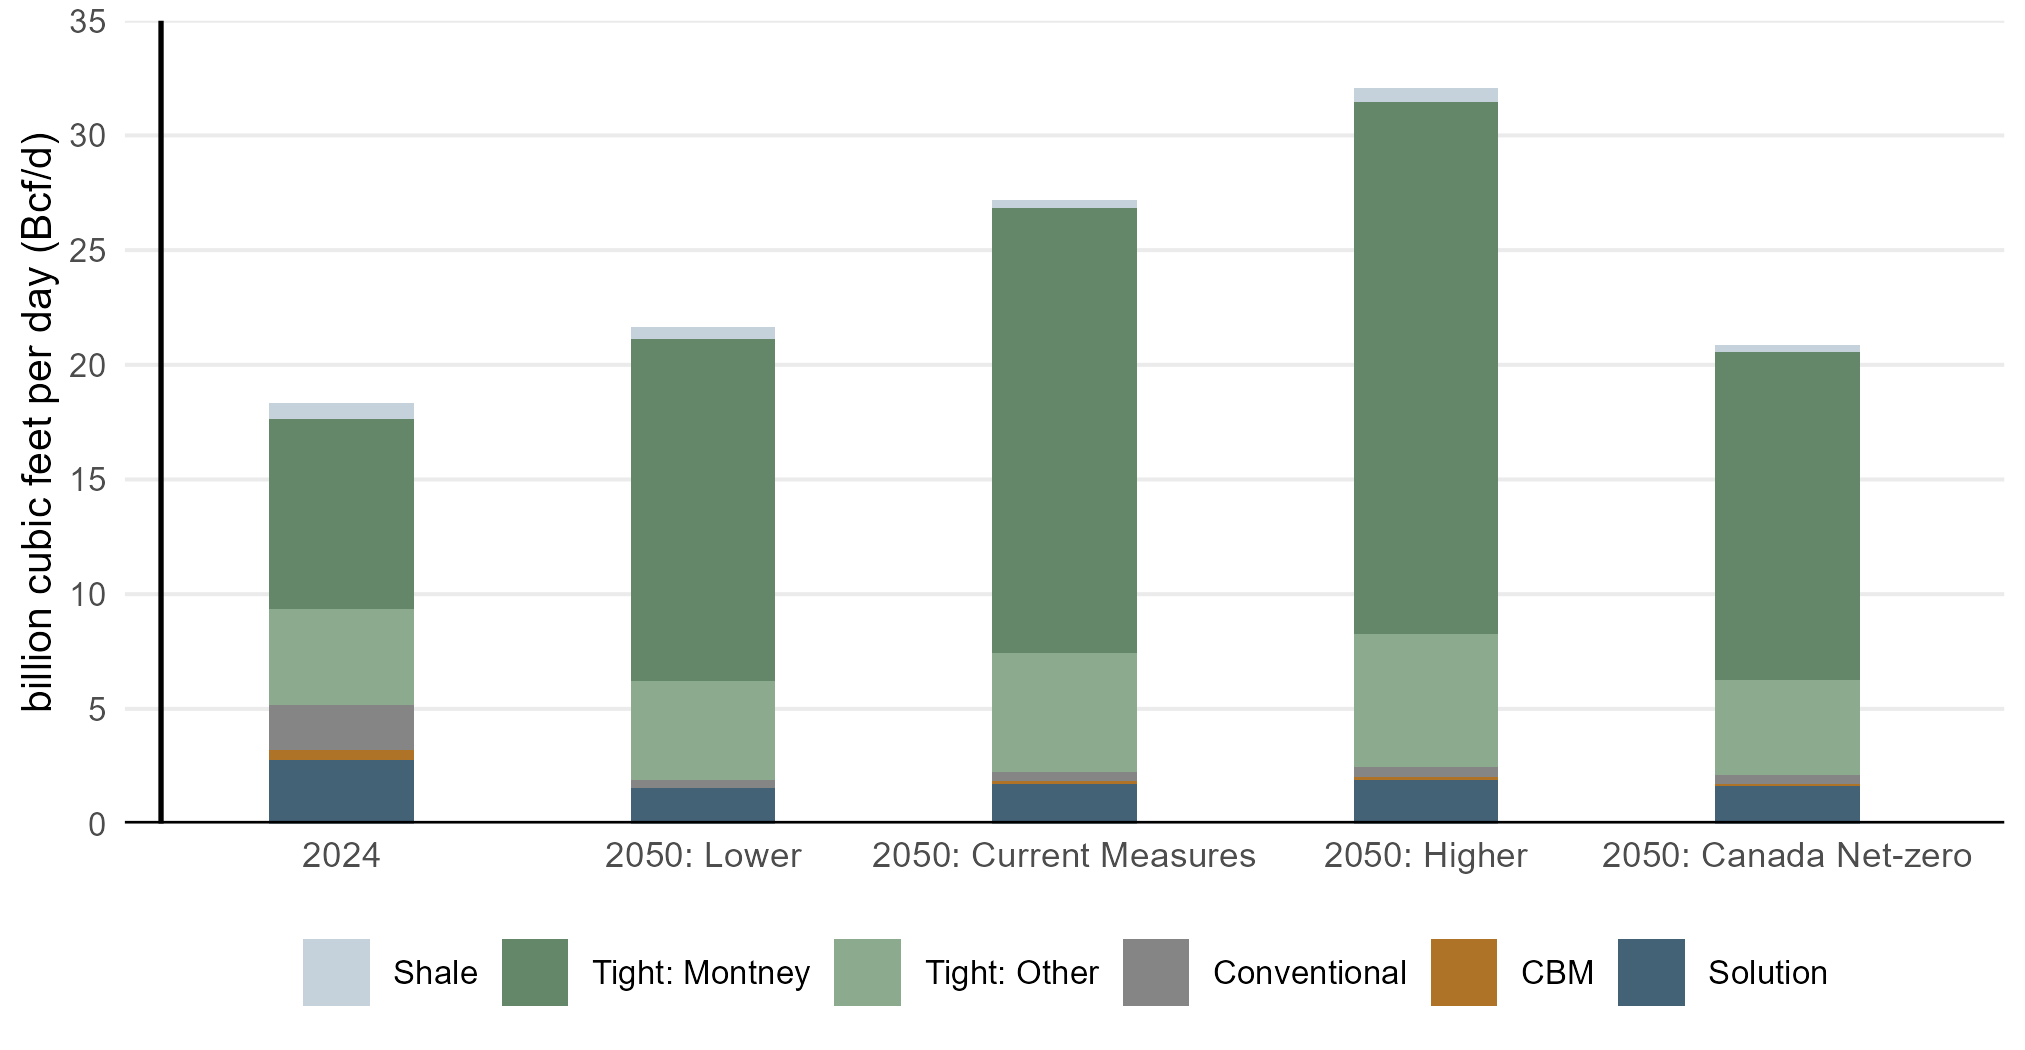
Figure R.14 shows annual natural gas production in Current Measures, by type, over the projection period. Current Measures natural gas production continues the upward trend of producing mostly tight gas—gas produced from organic-rich shales or from low permeability sandstone, siltstone, limestone or dolostone reservoirs. Tight gas reservoirs typically require the combination of horizontal drilling and multi-stage hydraulic fracturing to achieve economic rates of production. Tight gas, which made up 28% of production in 2005 and 68% in 2024, accounts for 85% in 2035 and 90% in 2050. Tight gas production growth is largely centered in the Montney area in Northeast British Columbia and Northwest Alberta. Conventional, solution, and coal bed methane (CBM) decline to varying degrees in the long term. Figure R.15 shows that this trend happens in the Higher scenario, Lower scenario, and Canada Net-zero as well.
How does natural gas production change throughout the projection period?
Discover the data for yourself using our interactive visualization tool. View projected natural gas production.
Text Alternative: This stacked area chart shows natural gas production under the Current Measures scenario, broken down by production type from 2015 to 2050. It displays production from solution gas, coalbed methane (CBM), conventional gas, tight gas, and shale gas. Over the period shown, total natural gas production increases, with tight gas representing the largest and growing share of production in later years.
Text Alternative: This chart compares natural gas production by production type in 2024 and in 2050 across all scenarios. For each year and scenario, total production is shown as stacked bars, with contributions from solution gas, coalbed methane (CBM), conventional gas, tight gas, and shale gas. Total natural gas production varies across scenarios in 2050, with tight gas accounting for the largest share in all cases.

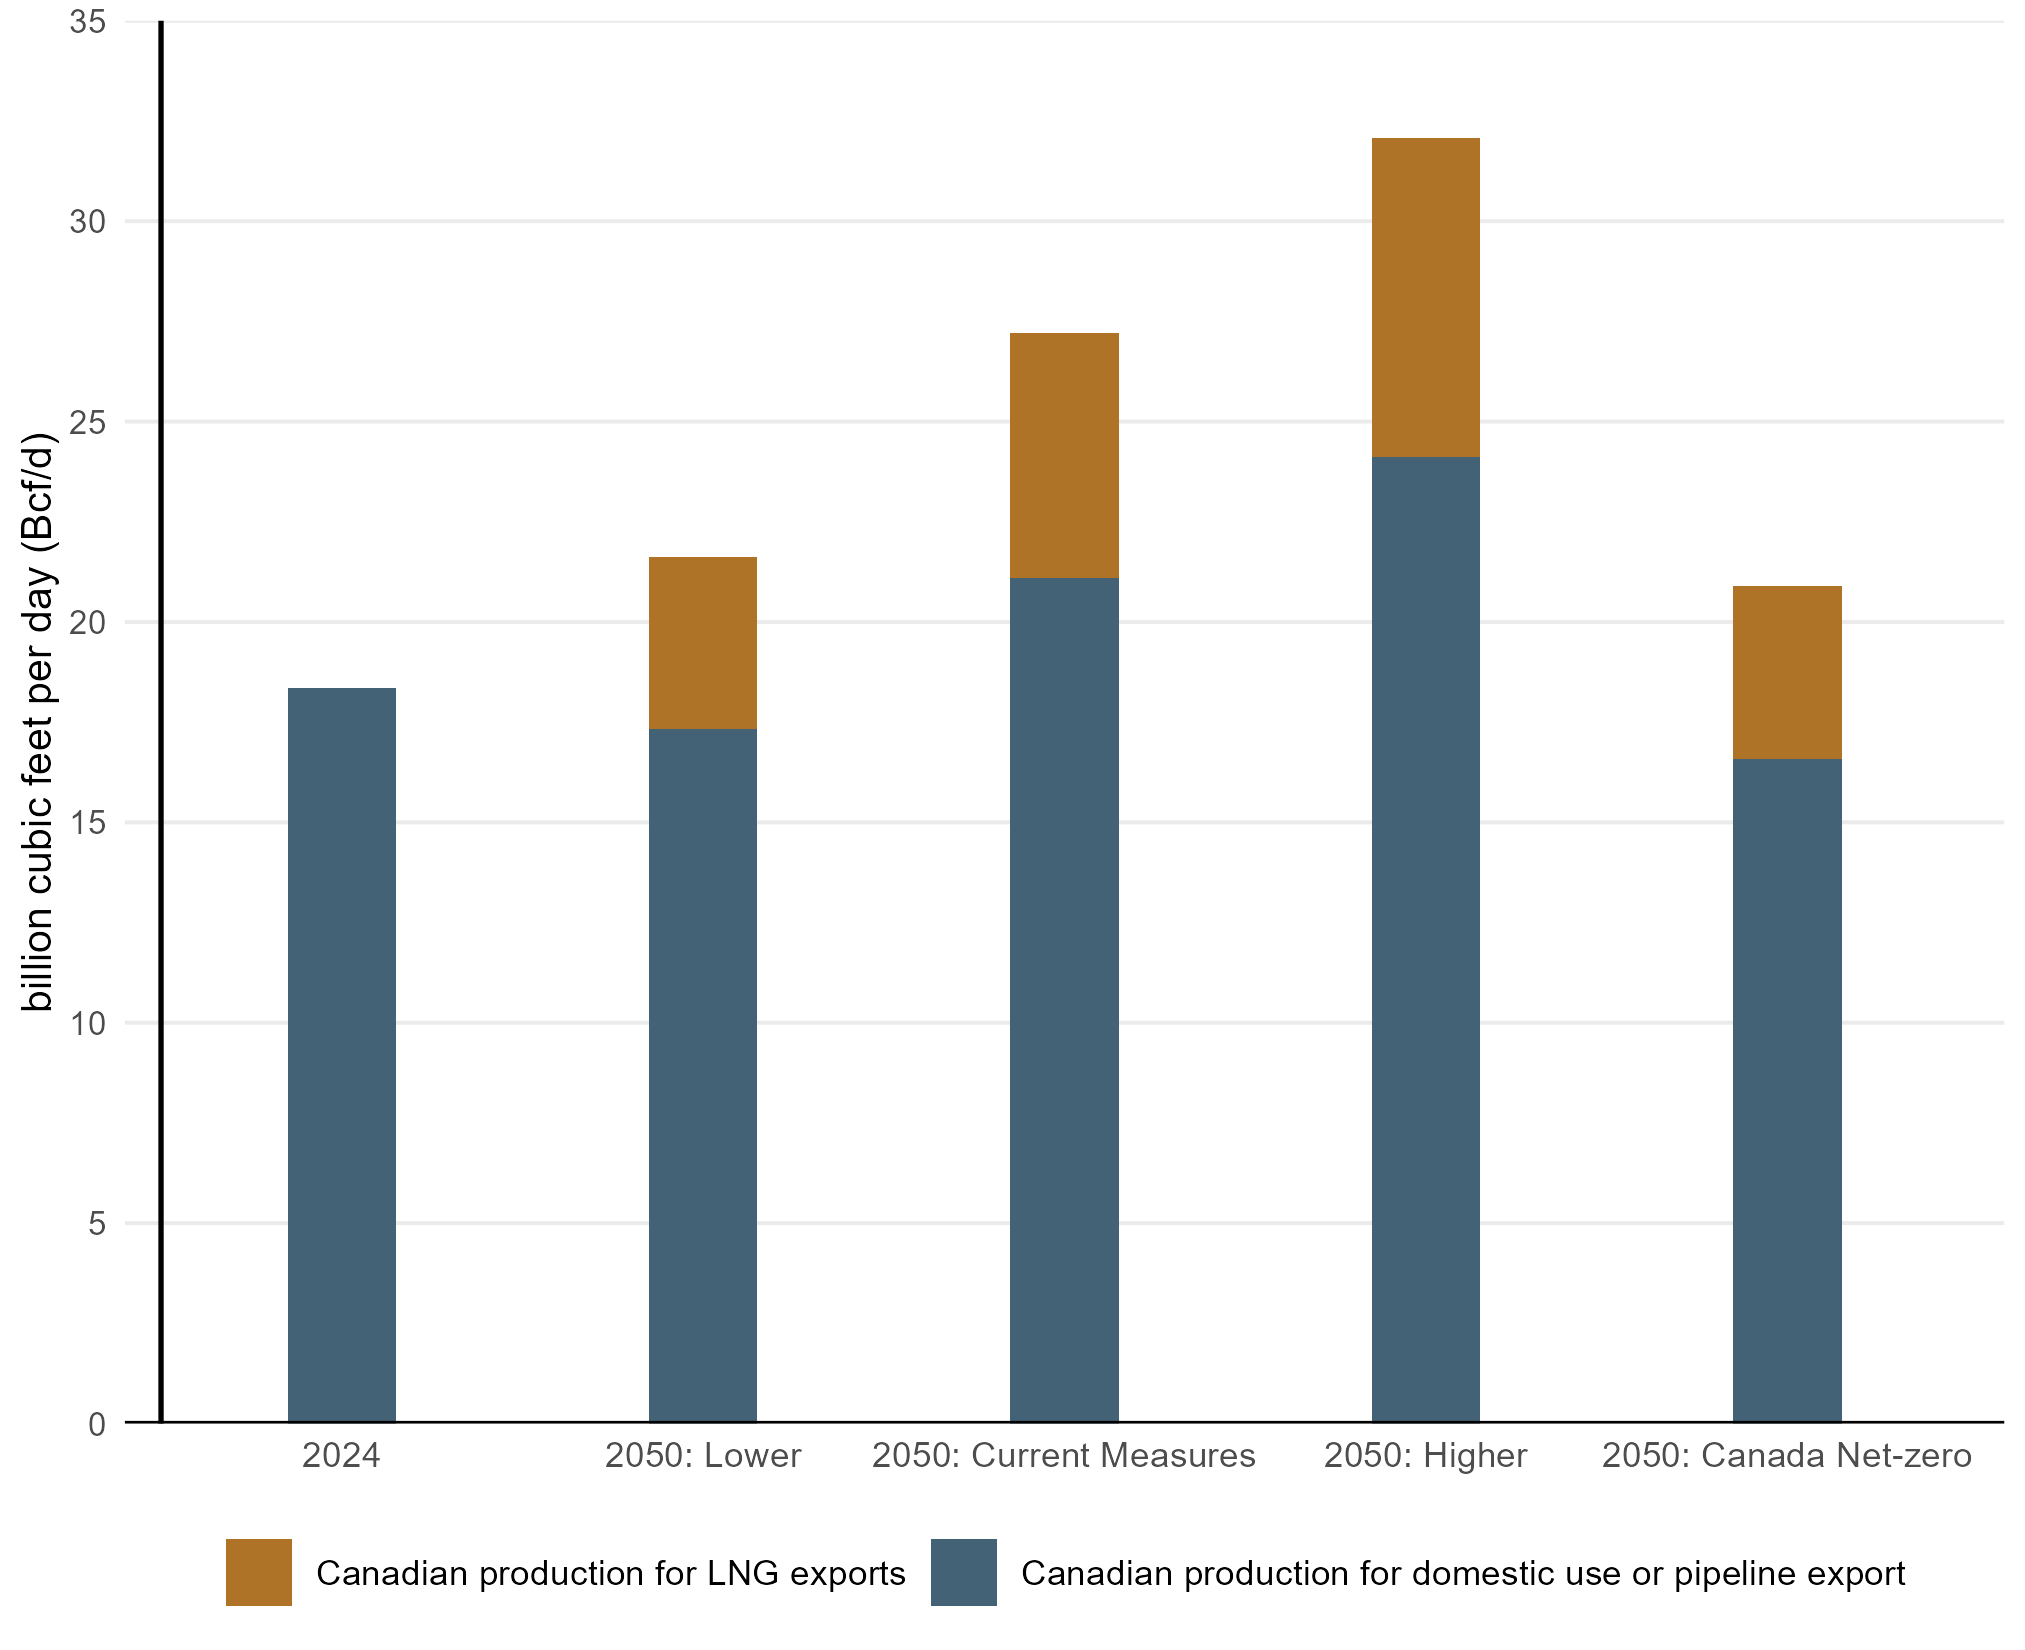
LNG exports are a key driver of natural gas production growth. As noted in the Scenarios and Assumptions chapter, for the purpose of our projections, we assume 75% of gas that goes to LNG exports is dedicated production that only exists because of the LNG export volumes we assume in each scenario. We assume 75% is incremental production because some LNG exporters also own a large amount of gas resources in western Canada and have announced plans to produce gas from these corporate resources to at least partially supply their LNG exports, indicating this production may be less tied to North American gas prices. Further, some of these exporters are also large, global producers of natural gas and can potentially tap into a global pool of investment capital to fund development, capital that may not otherwise be available to domestic producers. We assume 25% comes from production that is driven by the price assumptions described in the Scenarios and Assumptions chapter, because the North American natural gas market is highly integrated, and it is likely that some gas going towards LNG would be purchased.
Figure R.16 breaks down total production in 2024 and 2050 between traditional markets for that production—domestic demand and pipeline exports—and exports from B.C. LNG projects. Overall, total production in all four scenarios in 2050 is higher than 2024 levels, with growth ranging from about 15%, 2024 to 2050, in the Lower scenario and Canada Net-zero, to nearly 50% in Current Measures, and nearly 75% in the Higher scenario. As shown in Figure R.16, much of this growth goes towards LNG exports. Natural gas going to traditional markets actually decreases in the Lower scenario and Canada Net-zero and increases by 15% in Current Measures and 32% in the Higher scenario. This represents a significant diversification of Canadian natural gas trade, from nearly all exports going to the U.S. via pipeline (in 2024, 8.64 Bcf/d of natural gas was exported by pipeline), to potentially over a third of exports with the ability to reach global markets via LNG in all scenarios by 2050Footnote 13.
Description: This figure shows natural gas production and its disposition in 2024 and in 2050 across all scenarios. Each bar is split into Canadian production for domestic use or pipeline exports and Canadian production for LNG exports. By 2050 in the Lower and Canada Net-zero scenarios, total production is moderately above 2024 levels, driven by 4.25 Bcf/d of LNG exports. In Current Measures, production is higher, driven by both traditional markets for Canadian gas and LNG exports of 6.1 Bcf/d. The Higher scenario shows the largest increase in production and LNG exports of 7.9 Bcf/d.
Hydrogen is an energy carrier that can be produced from a range of energy sources and used across multiple sectors. Our focus in this section is on incremental hydrogen demand and its production by methods that emit little or no CO2.Footnote 14
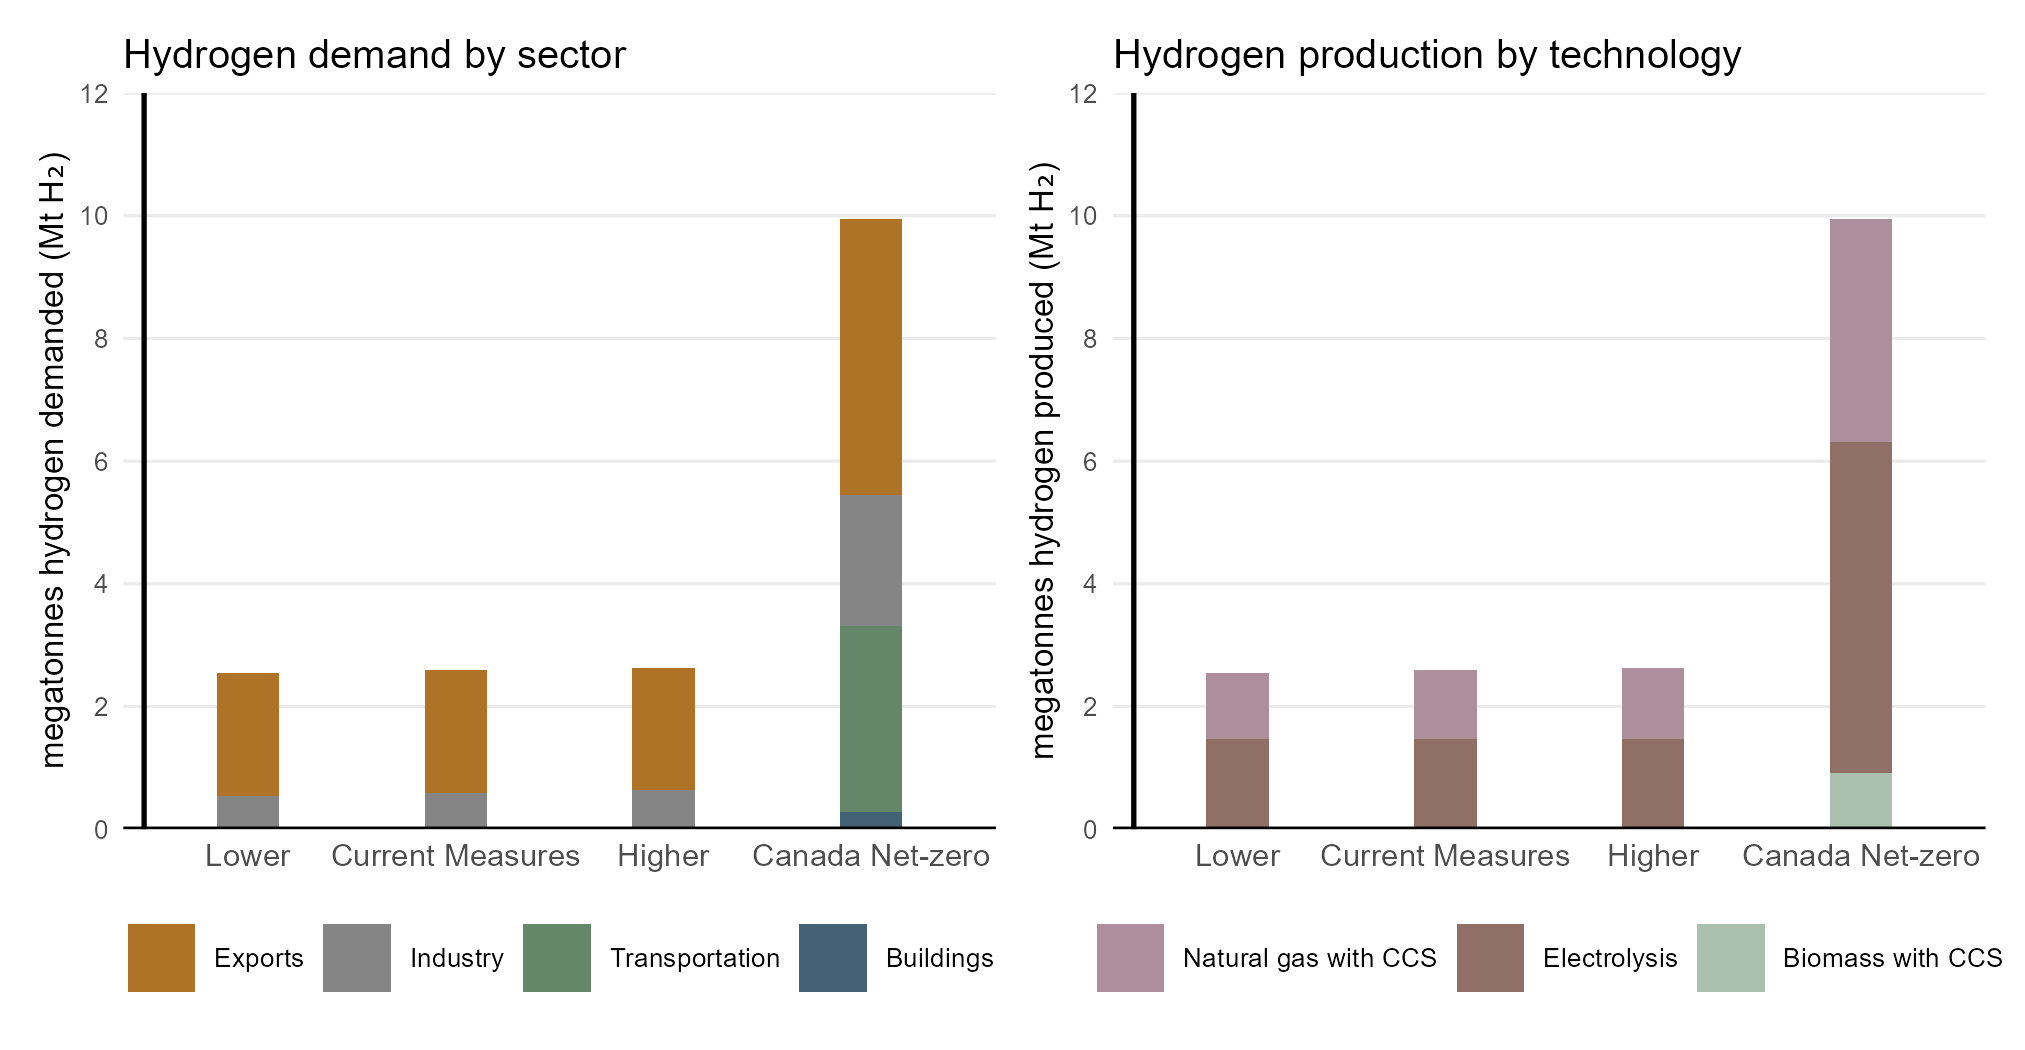
Our projections for additional low and non-emitting hydrogen are driven by growth in domestic demand as well as hydrogen produced for export. Hydrogen remains a niche technology in Current Measures, and the Higher and Lower scenarios, mostly in the industrial sector. In Canada Net-zero, hydrogen makes up about 5% of the end-use demand mix by 2050. We assume hydrogen produced for export increases after 2030 in all scenarios, reaching 2 million tonnes (MT) by 2050 in Current Measures, the Higher, and Lower scenarios, and 4.5 MT by 2050 in Canada Net-zero.
Combined, total non-emitting or low-emissions hydrogen production reaches over 2.5 MT by 2050 in Current Measures, the Higher scenario, and the Lower scenario, and around 10 MT in Canada Net-zero. It is produced using electrolysis technology, with electricity from dedicated renewable electricity or increasingly non-emitting electricity from the grid, as well as natural gas with CCUS technology. Figure R.17 shows where hydrogen is used in 2050 (left chart) and how it is produced (right chart).
Text Alternative: This figure shows hydrogen demand by sector and hydrogen production by technology in 2050 for all scenarios. The left panel illustrates demand by sector, with bars representing the different scenarios. Demand is similar across scenarios, except for Canada Net-zero where demand is about four times greater—the largest portion of which is from exports, and to a lesser extent industry and transportation. The right panel shows hydrogen production by technology for the same scenarios. Production levels are again similar across all scenarios, aside from Canada Net-zero where production is about four times greater—largely driven by growth in electrolysis and natural gas with CCUS.
Bioenergy is an important part of the energy mix, and it is currently used in a variety of sectors. In our projections, bioenergy adoption is based on technology, economic, and policy assumptions. We assess the feedstocks used to produce bioenergy based on several things, such as feedstock affordability, suitability, availability and cost, preprocessing requirements, required land use, and production technology.
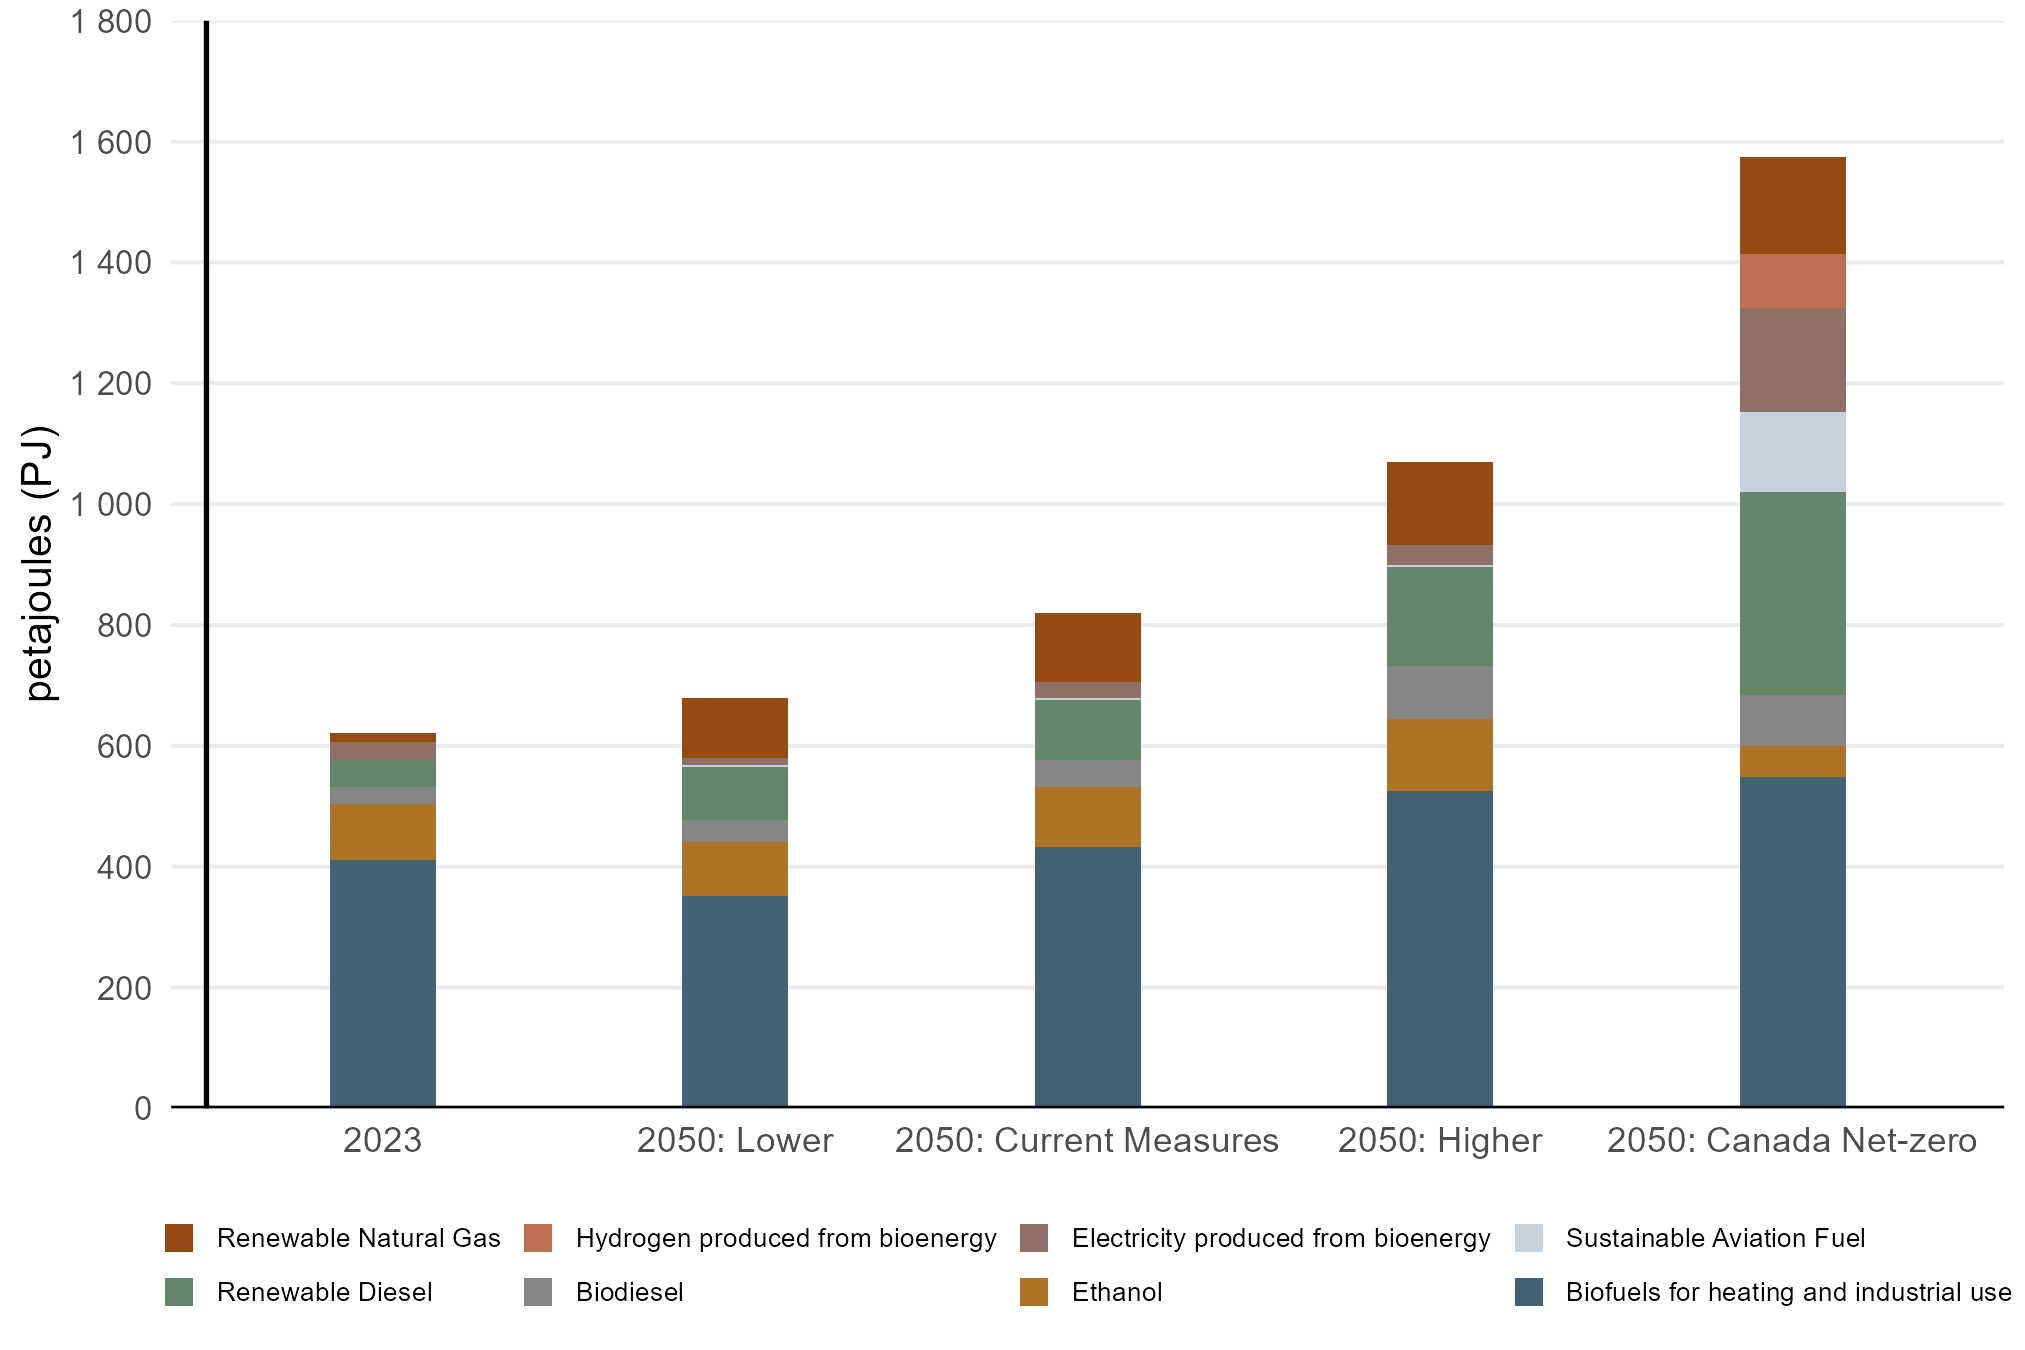
Total end-use bioenergy demand, including electricity and hydrogen produced from bioenergy, increases by 10% in the Lower scenario, 32% in Current Measures, 73% in the Higher scenario, and around 150% in Canada Net-zero (Figure R.18). Policies such as Canada’s Clean Fuels Regulations, and provincial initiatives like B.C. and Quebec’s renewable natural gas blending mandates, are key factors in increasing bioenergy demands by 2050. In Canada Net-zero, increasing use of electricity and hydrogen produced with bioenergy (mostly with CCUS), as well as sustainable aviation fuel, become a large part of Canada’s bioenergy use.
Text Alternative: This stacked bar chart shows end-use bioenergy demand in 2023 and in 2050 across the four scenarios. Total demand rises in every scenario, ranging from a modest growth in Lower to a substantial growth in Higher, and more than doubling in Canada Net-zero. Biofuels for heating and industrial use remain the biggest component throughout, with a slight decrease in the Lower scenario. Aside from ethanol, which sees a decline in all scenarios, and hydrogen from bioenergy which only sees growth in Canada Net-zero, all the other fuels are projected to grow by 2050 in our scenarios. These other fuels are biodiesel, renewable diesel, electricity produced from bioenergy, and renewable natural gas. The largest growth appears in Canada Net-zero.
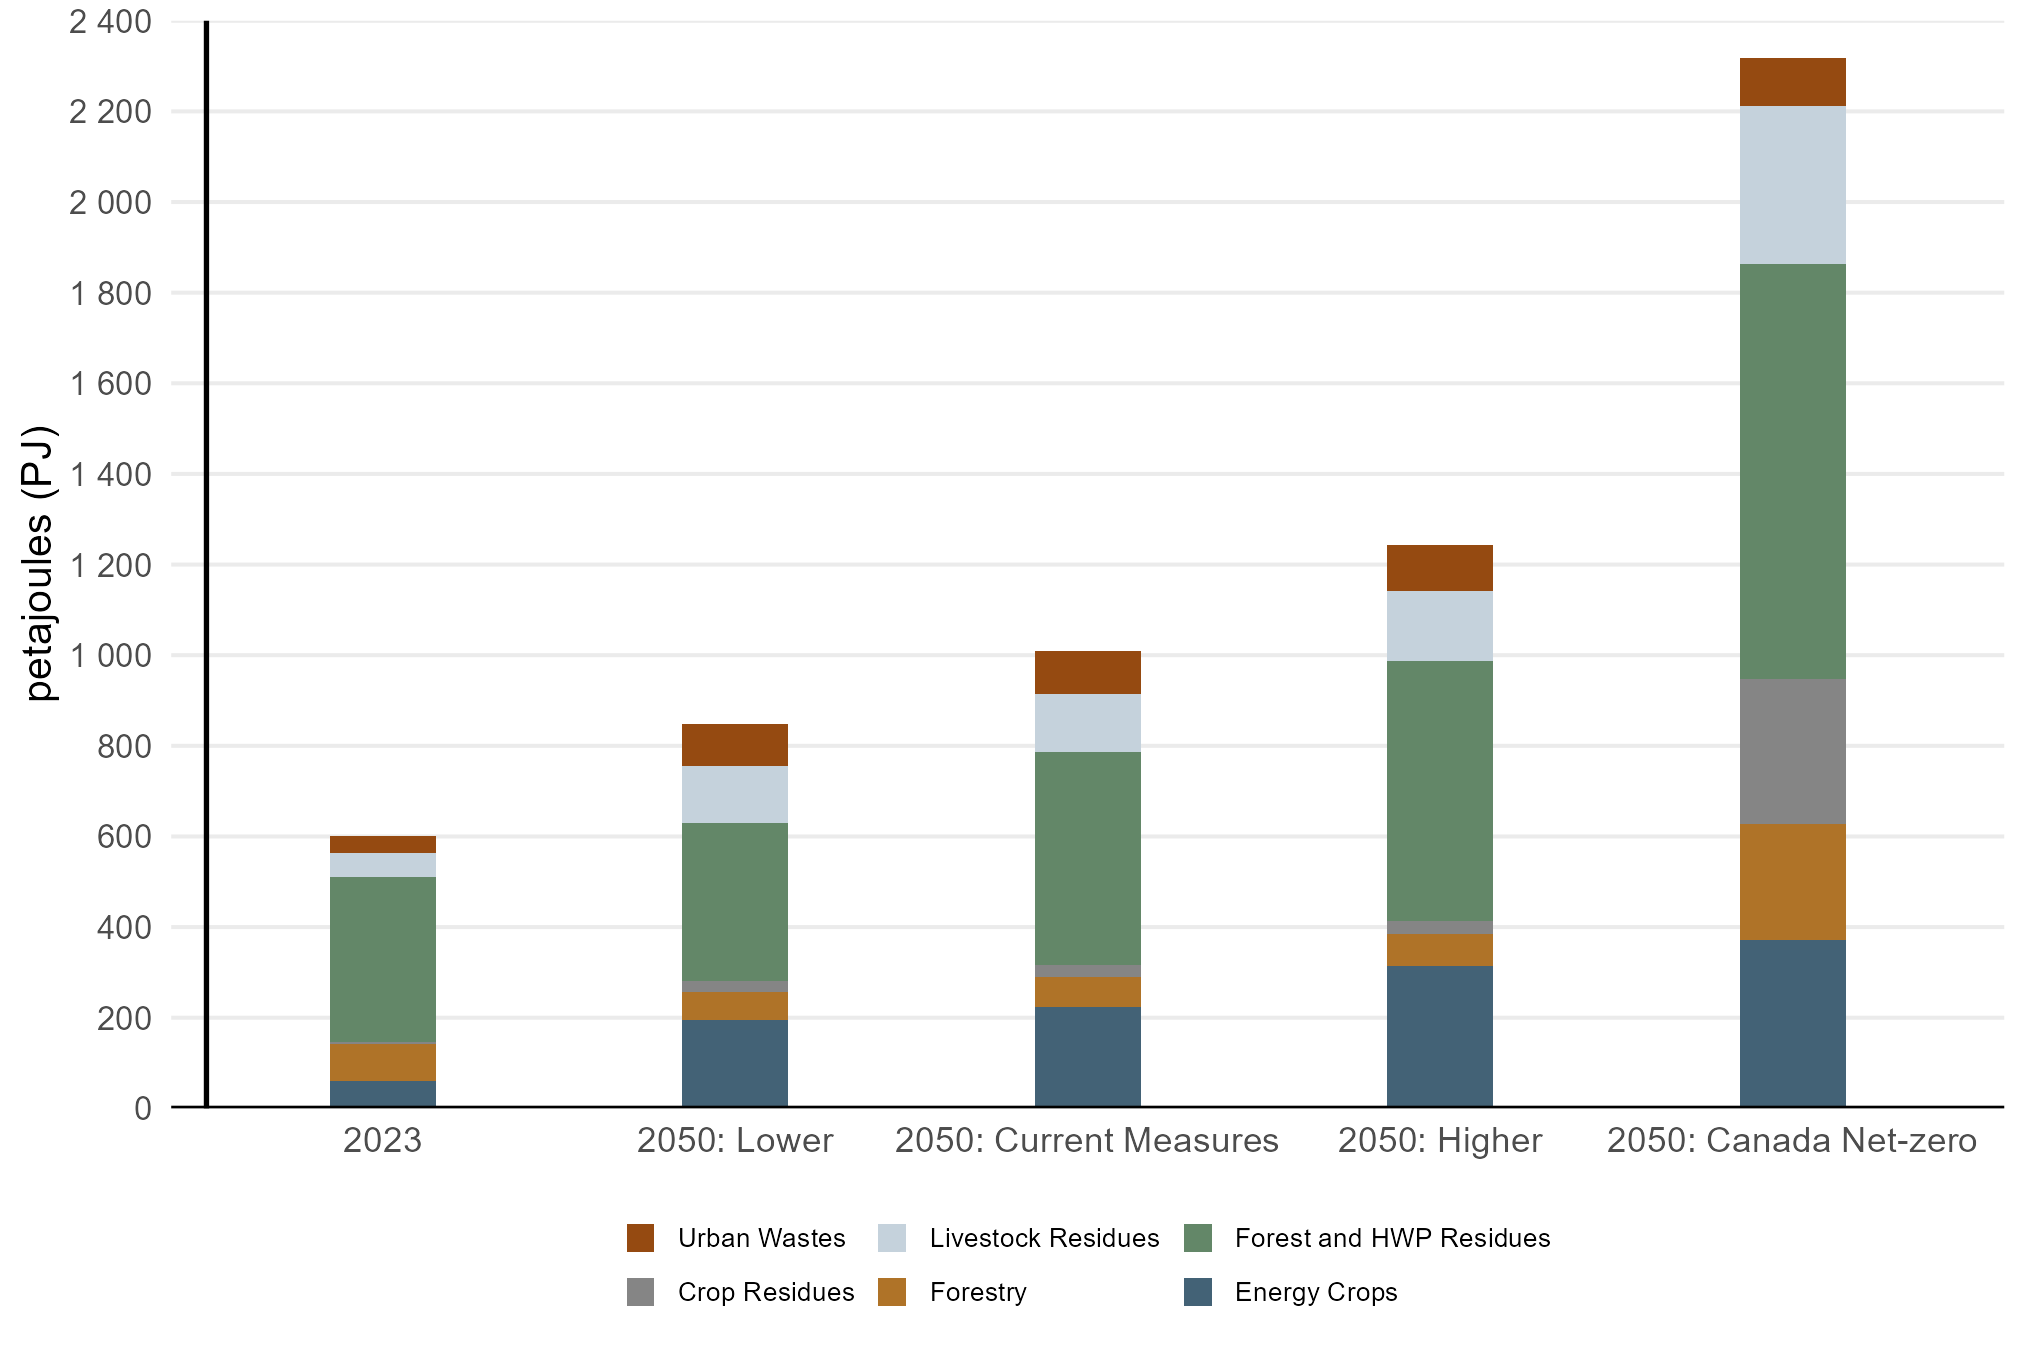
We project this growth in production will be met by a variety of different sources (Figure R.19). In 2023, most bioenergy production is sourced from forest and harvested wood products (HWP) residues. In Current Measures, forest and HWP residuesFootnote 15, livestock residues, urban wastes, and energy crops (e.g., corn, canola and willow), make up most of the growth. The incremental feedstocks needed in Canada Net-zero come from a variety of different sources, including large increases in crop residues and forest and HWP residues. Imports also play a key role in meeting domestic bioenergy demand, mainly for liquid biofuels (e.g., ethanol, biodiesel, and renewable diesel) and RNG.
In Figure R.18, bioenergy demand by feedstock is shown in end-use terms. In comparison, R.19 expresses bioenergy as primary production. Trends may differ across the two charts because of conversion efficiencies. Processes like bioenergy with carbon capture and storage (BECCS), for example, have lower efficiency, requiring more petajoules of bioenergy feedstock to generate a petajoule of electricity.
Text Alternative: This chart shows bioenergy production by feedstock in 2023 and 2050 for all scenarios. The feedstocks are energy crops, forestry, crop residue, forest and HWP residue, livestock residue, and urban wastes. Across scenarios in 2050, forest and HWP residue, livestock residue, and energy crops tend to occupy the largest share.
Energy and the economy are deeply connected. Energy services support Canadians’ quality of life, whereas fuels and electricity are essential for producing goods and services across the economy. Economic activity influences the quantity and types of energy used in Canada, whereas factors like exchange and interest rates impact energy markets. At the same time, our energy sector is both a significant consumer of energy and a major contributor to economic activity—driving trends in energy demand, investments, exports, and other factors. This section explains some of the key macroeconomic drivers in our projections.

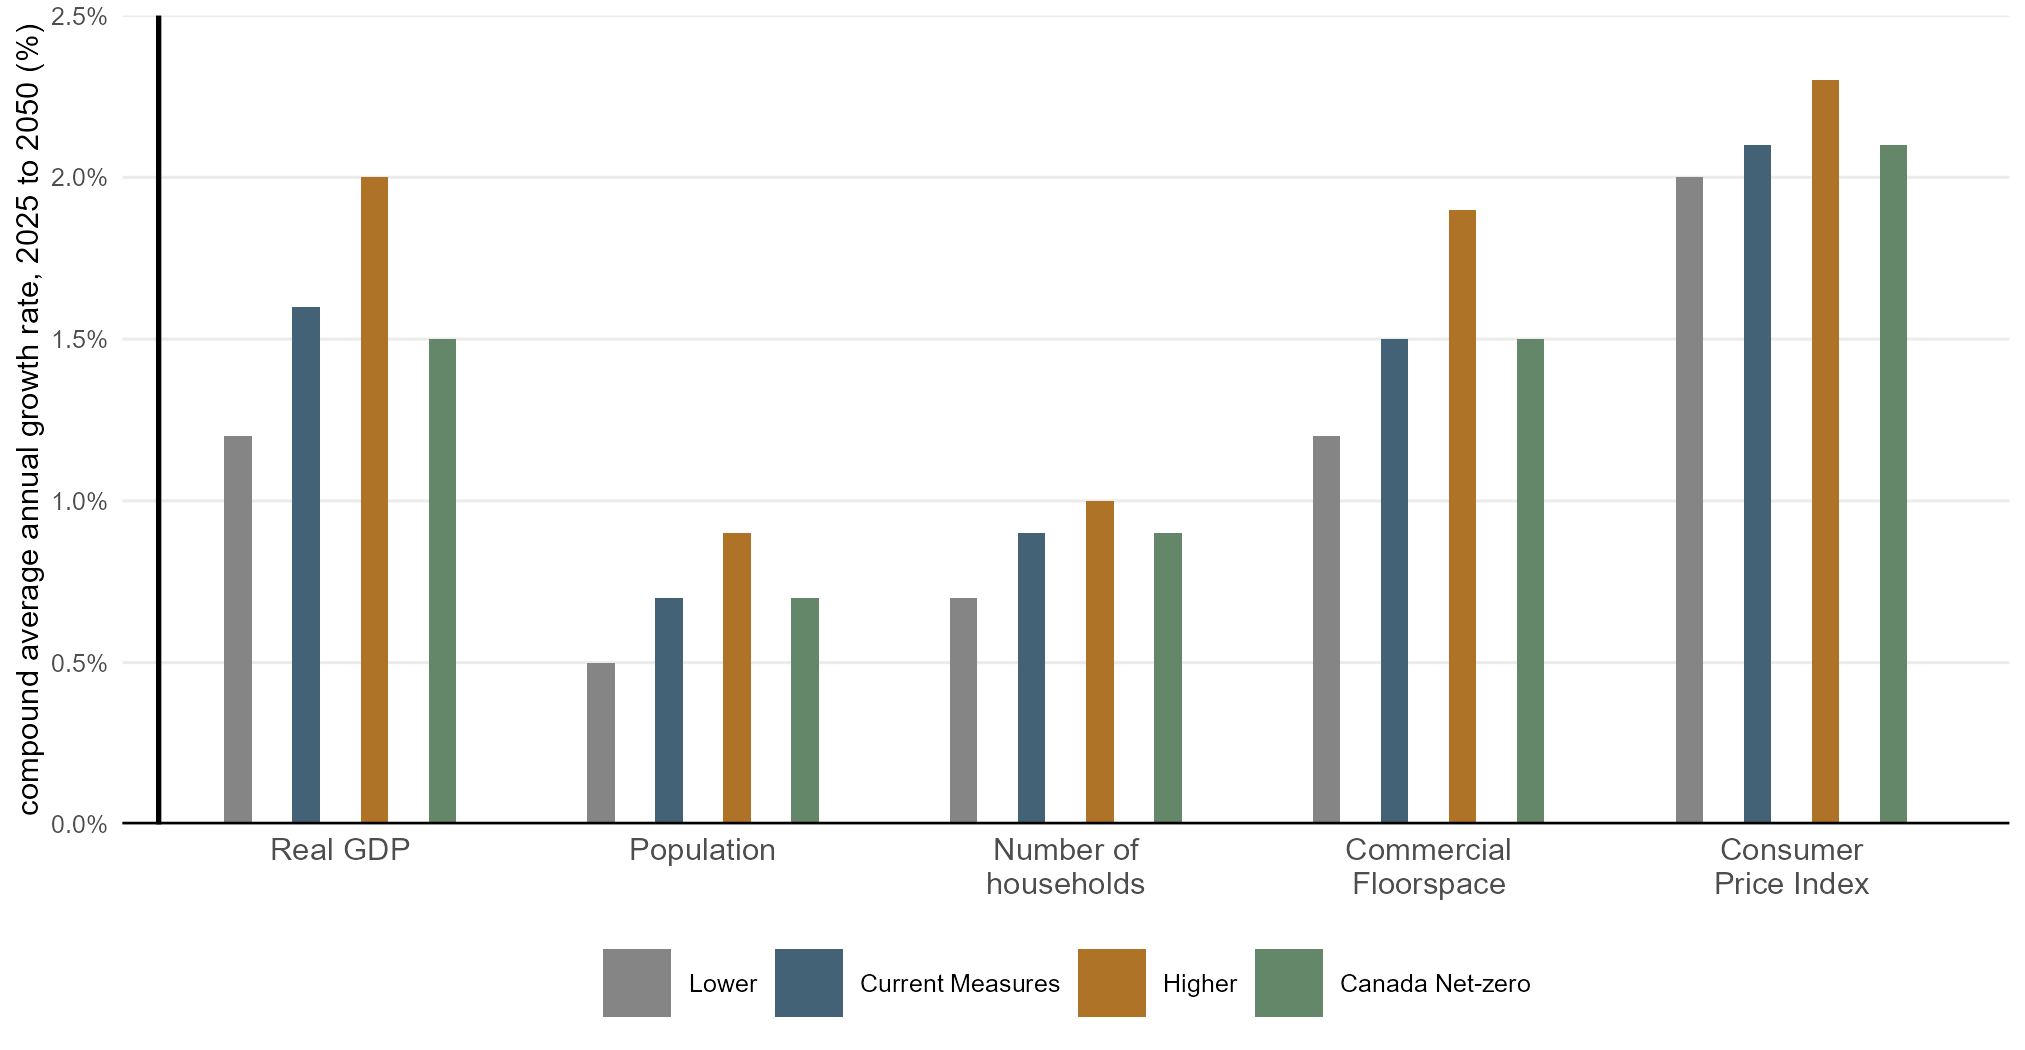
Key economic indicators vary across the four scenarios, as shown in Figure R.20. Current Measures shows moderate economic growth over the projection period, with population increasing by 0.7% per year, and real gross domestic product (GDP) increasing by 1.6% per year. The annual inflation rate is around 2.1%.
In the Higher scenario, we assume that key economic drivers grow faster. This, in combination with accelerated energy activity, leads to stronger economic growth, with real GDP growing by 2% per year, and a population growth rate of 0.9%.Footnote 16 An economy that is growing faster with higher energy prices, as we assume in the Higher scenario, also has moderately higher inflation compared to Current Measures, at 2.3% per year.
In the Lower scenario, our assumptions related to macroeconomic trends and energy prices lead to weaker economic growth compared to Current Measures. Real GDP grows by 1.2% per year, population grows 0.5% per year, and inflation is moderately lower than in Current Measures, at 2% per year.

By 2050, the Higher and Lower scenarios provide a significant range around Current Measures. In the Higher scenario, real GDP is 11%, or over 500 billion $2024 CAD higher than Current Measures, and Canada’s population reaches 52 million, compared to 50 million in Current Measures. In the Lower scenario, real GDP is nearly 10%, or over 450 billion $2024 CAD lower than in Current Measures, and population is 47 million.
Canada Net-zero includes lower upstream oil and natural gas activity and stronger investment in clean technology (as discussed earlier in this chapter). Overall, this leads to economic growth trends that are marginally lower than Current Measures, and significantly higher than the Lower scenario.
The Canada U.S. exchange rate averages 0.75 CAD/US$ in Current Measures from 2025 to 2050, 0.76 CAD/US$ in the Higher scenario, 0.73 CAD/US$ in the Lower scenario, and 0.74 CAD/US$ in Canada Net-zero.

How do key economic drivers change over the projection period?
Discover the data for yourself using our interactive visualization tool. View changes in key economic drivers.
Text Alternative: This chart shows the growth rate of key economic indicators in all scenarios. Compared to Current Measures, growth in these economic indicators (real GDP, population, number of households, commercial floorspace, and the consumer price index) is highest in the Higher scenario, lowest in the Lower scenario, and for the most part similar in Current Measures and Canada Net-zero.
The greenhouse gas (GHG) emissions projections outlined in this chapter rely largely on the energy projections described previously in this chapter, as well as our estimates and assumptions about non-energy related GHG emissions from sources like agricultural waste and land-use changes.
The historical GHG emissions reported in this report are based on Canada’s National Inventory Report. The latest historical emissions data available is from 2023. ECCC produces the official analysis of Canada’s current emissions outlook and performance against its climate commitments.
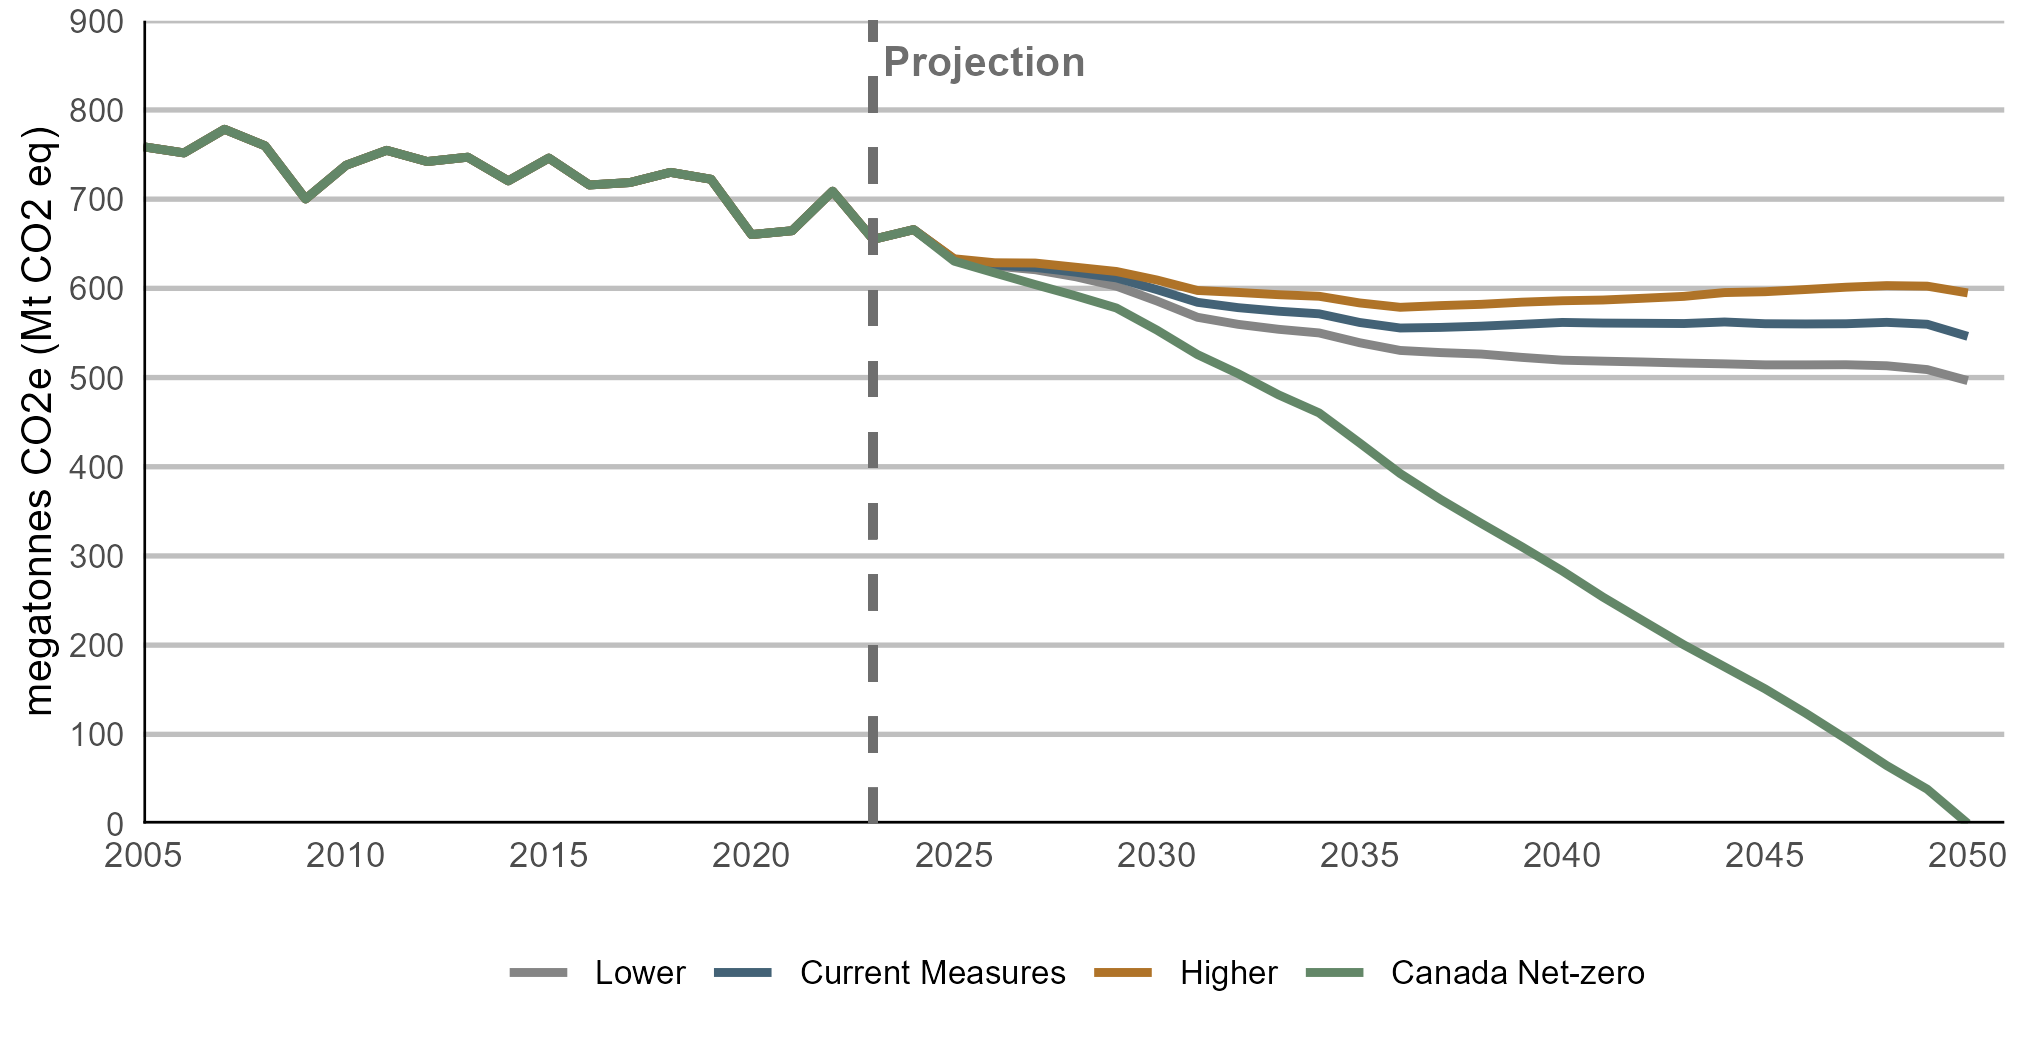
GHG emissions fall throughout the projection period in all scenarios (Figure R.21). GHG emissions in Current Measures fall steadily in the early part of the projection and are 21% lower than 2005 levels (nearly 9% lower than 2023) in 2030, and 28% lower than 2005 levels (17% lower than 2023) in 2050. The Higher and Lower scenarios assume the same domestic climate policies as in Current Measures, so it follows that these scenarios have higher and lower emissions, respectively, due to different economic activity levels. In 2050, emissions in the Higher scenarios are 9% higher than Current Measures (and 22% lower than 2005 levels), while in the Lower scenario, emissions are 9% lower than Current Measures (and 35% lower than 2005 levels). Net emissions reach zero in 2050 in Canada Net-zero, which is not a projection, but a pre-determined constraint on this scenario.
Which sectors emit the most GHGs in Canada? How do emissions change over the projection?
Discover the data for yourself using our interactive visualization tool. View emissions by sector.
Text Alternative: This figure shows total greenhouse gas (GHG) emissions from 2005 to 2050 across all scenarios. Historical emissions gradually declined from 2005 through the mid-2020s, then follow different future paths depending on the scenario. In Canada Net-zero, emissions decrease to reach net-zero in 2050. In the other scenarios, emissions continue their historical downward trend, though at a decelerated pace in Current Measures and the Higher scenario.
The electricity sector leads the way in emission reductions
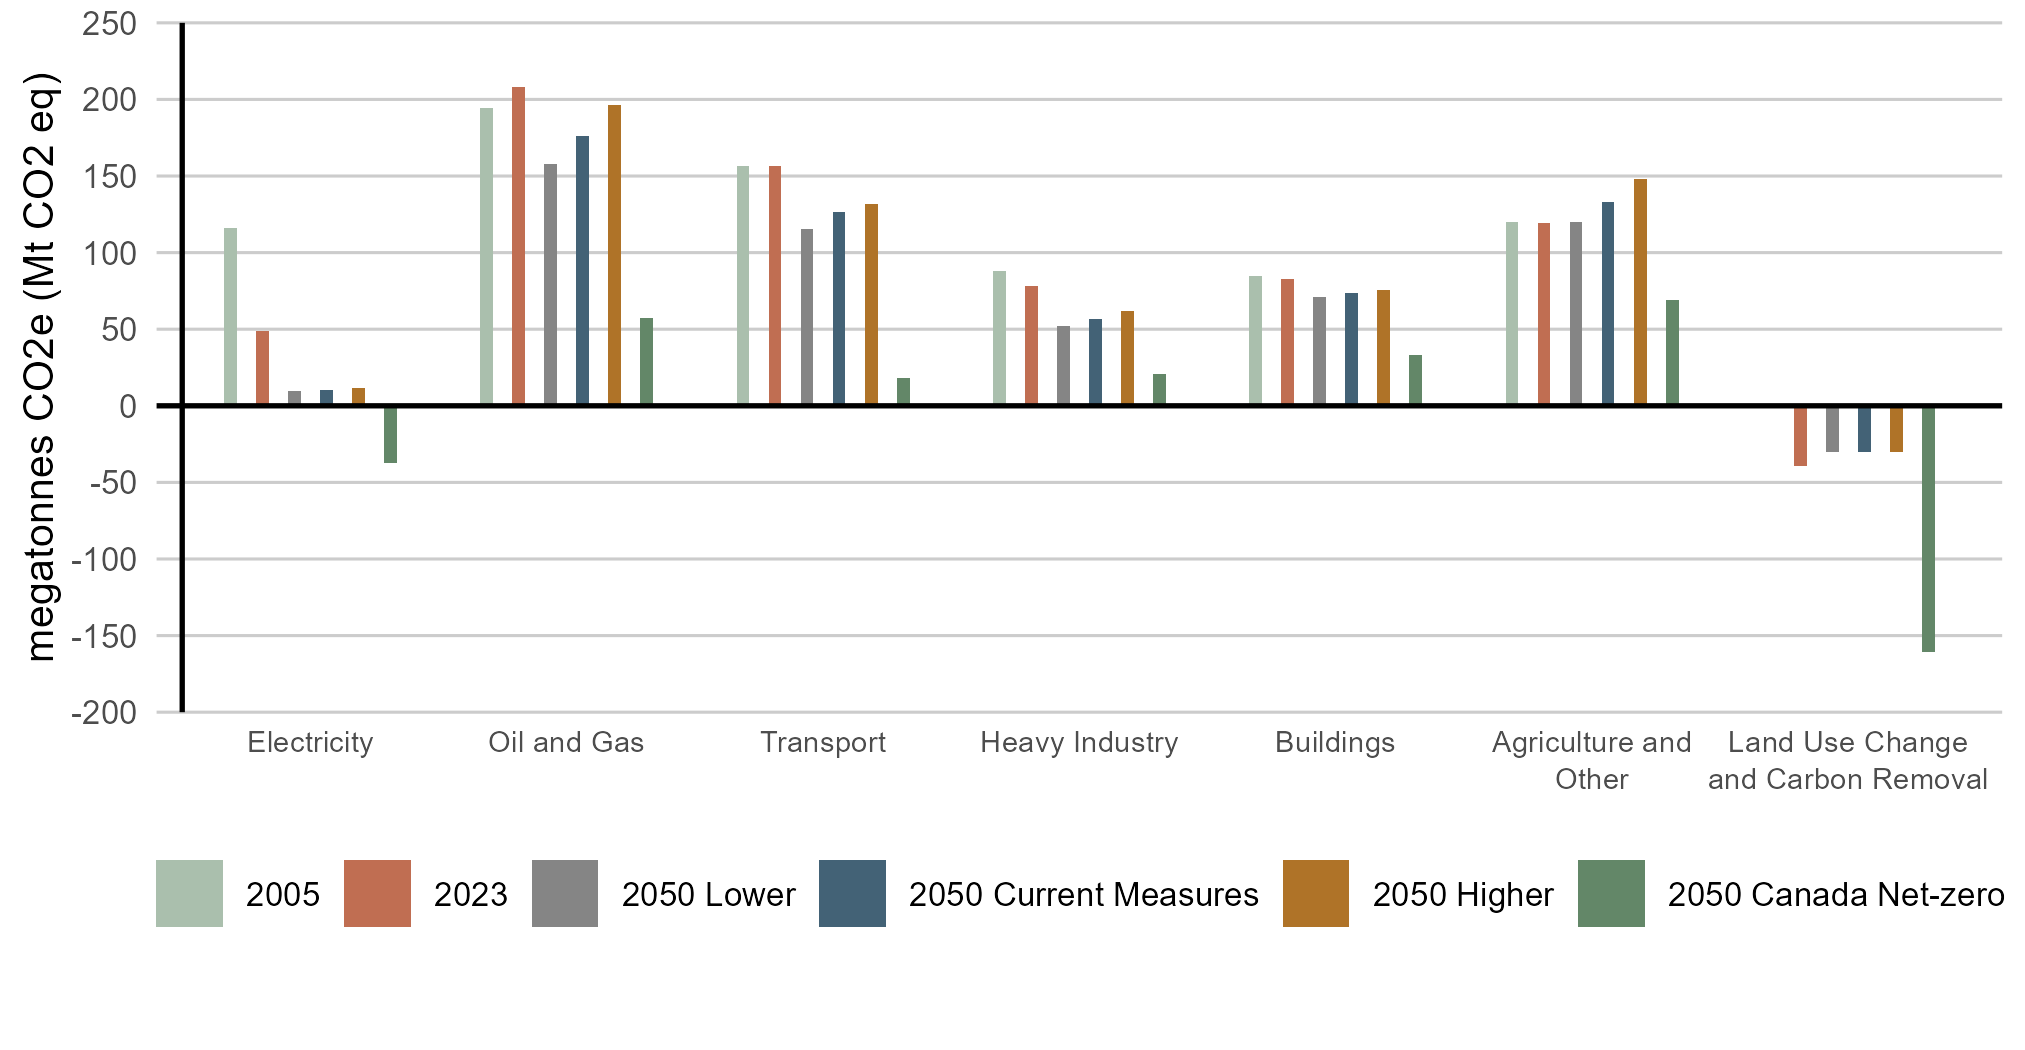
By 2050, most sectors have lower GHG emissions than in 2023 (Figure R.22). In Current Measures from 2023 to 2050, the largest declines come from electricity (-38 MT), oil and gas (-32 MT), and transportation (-30 MT). The electricity sector stands out, with over 90% lower emissions by 2050 in Current Measures, Higher, and Lower scenarios compared to the 2005 base year. This is a reduction on par, or above, what we see among other sectors even in Canada Net-zero.
In Canada Net-zero, all sectors follow the electricity sector and contribute to emissions reduction. The electricity sector reduces emissions even further and goes net-negative through the use of BECCS technology. In 2050, remaining emissions in agriculture, oil and natural gas, buildings, industry, transportation, and waste, are offset by negative emissions in the electricity sectorFootnote 17, as well as land-use change and carbon removal, which includes reductions from nature-based solutions, direct air capture, and other carbon dioxide removal options.
Text Alternative: This figure shows GHG emissions by economic sector for 2005, 2023, and 2050 across all scenarios. Columns show contributions from electricity, oil and gas, transport, heavy industry, buildings, agriculture and other, and land use change and carbon removal. The electricity sector shows significant declines across scenarios, from 49 MT in 2023 to around 14 MT in the other scenarios, and with negative emissions in Canada Net-zero. The Current Measures, Lower, and Higher scenarios all see various degrees of declines by 2050, with the exception of Agriculture and Other.