Scenarios are central to the Canada’s Energy Future series. They provide a structured way of exploring how Canada’s energy system could evolve under different sets of assumptions. Scenarios are not forecasts or predictions. They are tools that help us test how supply and demand for energy may change under varying policy, technology, market, and economic conditions.
This report includes four scenarios to explore Canada’s energy outlook. Current Measures is our version of a traditional baseline scenario often used in energy outlooks. It has a similar set of assumptions as the baseline scenarios used in other outlooks, such as Environment and Climate Change Canada (ECCC)’s GHG emission projections (their “With Measures” scenario) and the U.S. Energy Information Administration’s Annual Energy Outlook (their “Reference Case”). This type of scenario includes moderate economic growth and energy prices, policies currently in place, and moderate technological progress. Although we refer to it as a baseline, it is not a prediction or our view of a most likely scenario, and we do not assign probabilities to any of our scenarios. Our Current Measures scenario is most useful in comparison with other scenarios.
To explore some of the major uncertainties Canada and the world face when it comes to energy and the economy, we have developed two new scenarios: The Higher scenario and Lower scenario. These scenarios explore what might happen if some key drivers of Canada’s energy system—Canadian GDP growth, LNG exports, data centre load growth, and global oil and natural gas prices—trend higher or lower, respectively, compared to Current Measures. These scenarios effectively create a range around Current Measures.

To explore the potential impacts of a faster pace of climate action, we also include an update to the Canada Net-zero scenario, introduced in EF2023. Canada Net-zero is different because it begins with a predetermined end point—net-zero emissions for Canada in 2050—and then explores the question “what might a pathway to that end point look like?”. This scenario assumes that, in addition to Canada reaching net-zero by 2050, the rest of the world also increases its pace of climate actionFootnote 1 to meet current pledges but falls short of the ambitious transformation needed to limit warming to 1.5°C above pre-industrial levels. This leads to lower global oil and natural gas demand than in a baseline scenario (and hence lower oil and natural gas prices) and lower clean technology costs, as Canada benefits from increasing technological development both domestically and in the rest of the world.
Figure A.1 summarizes the scenario assumptions and highlights the key uncertainties each is designed to explore.
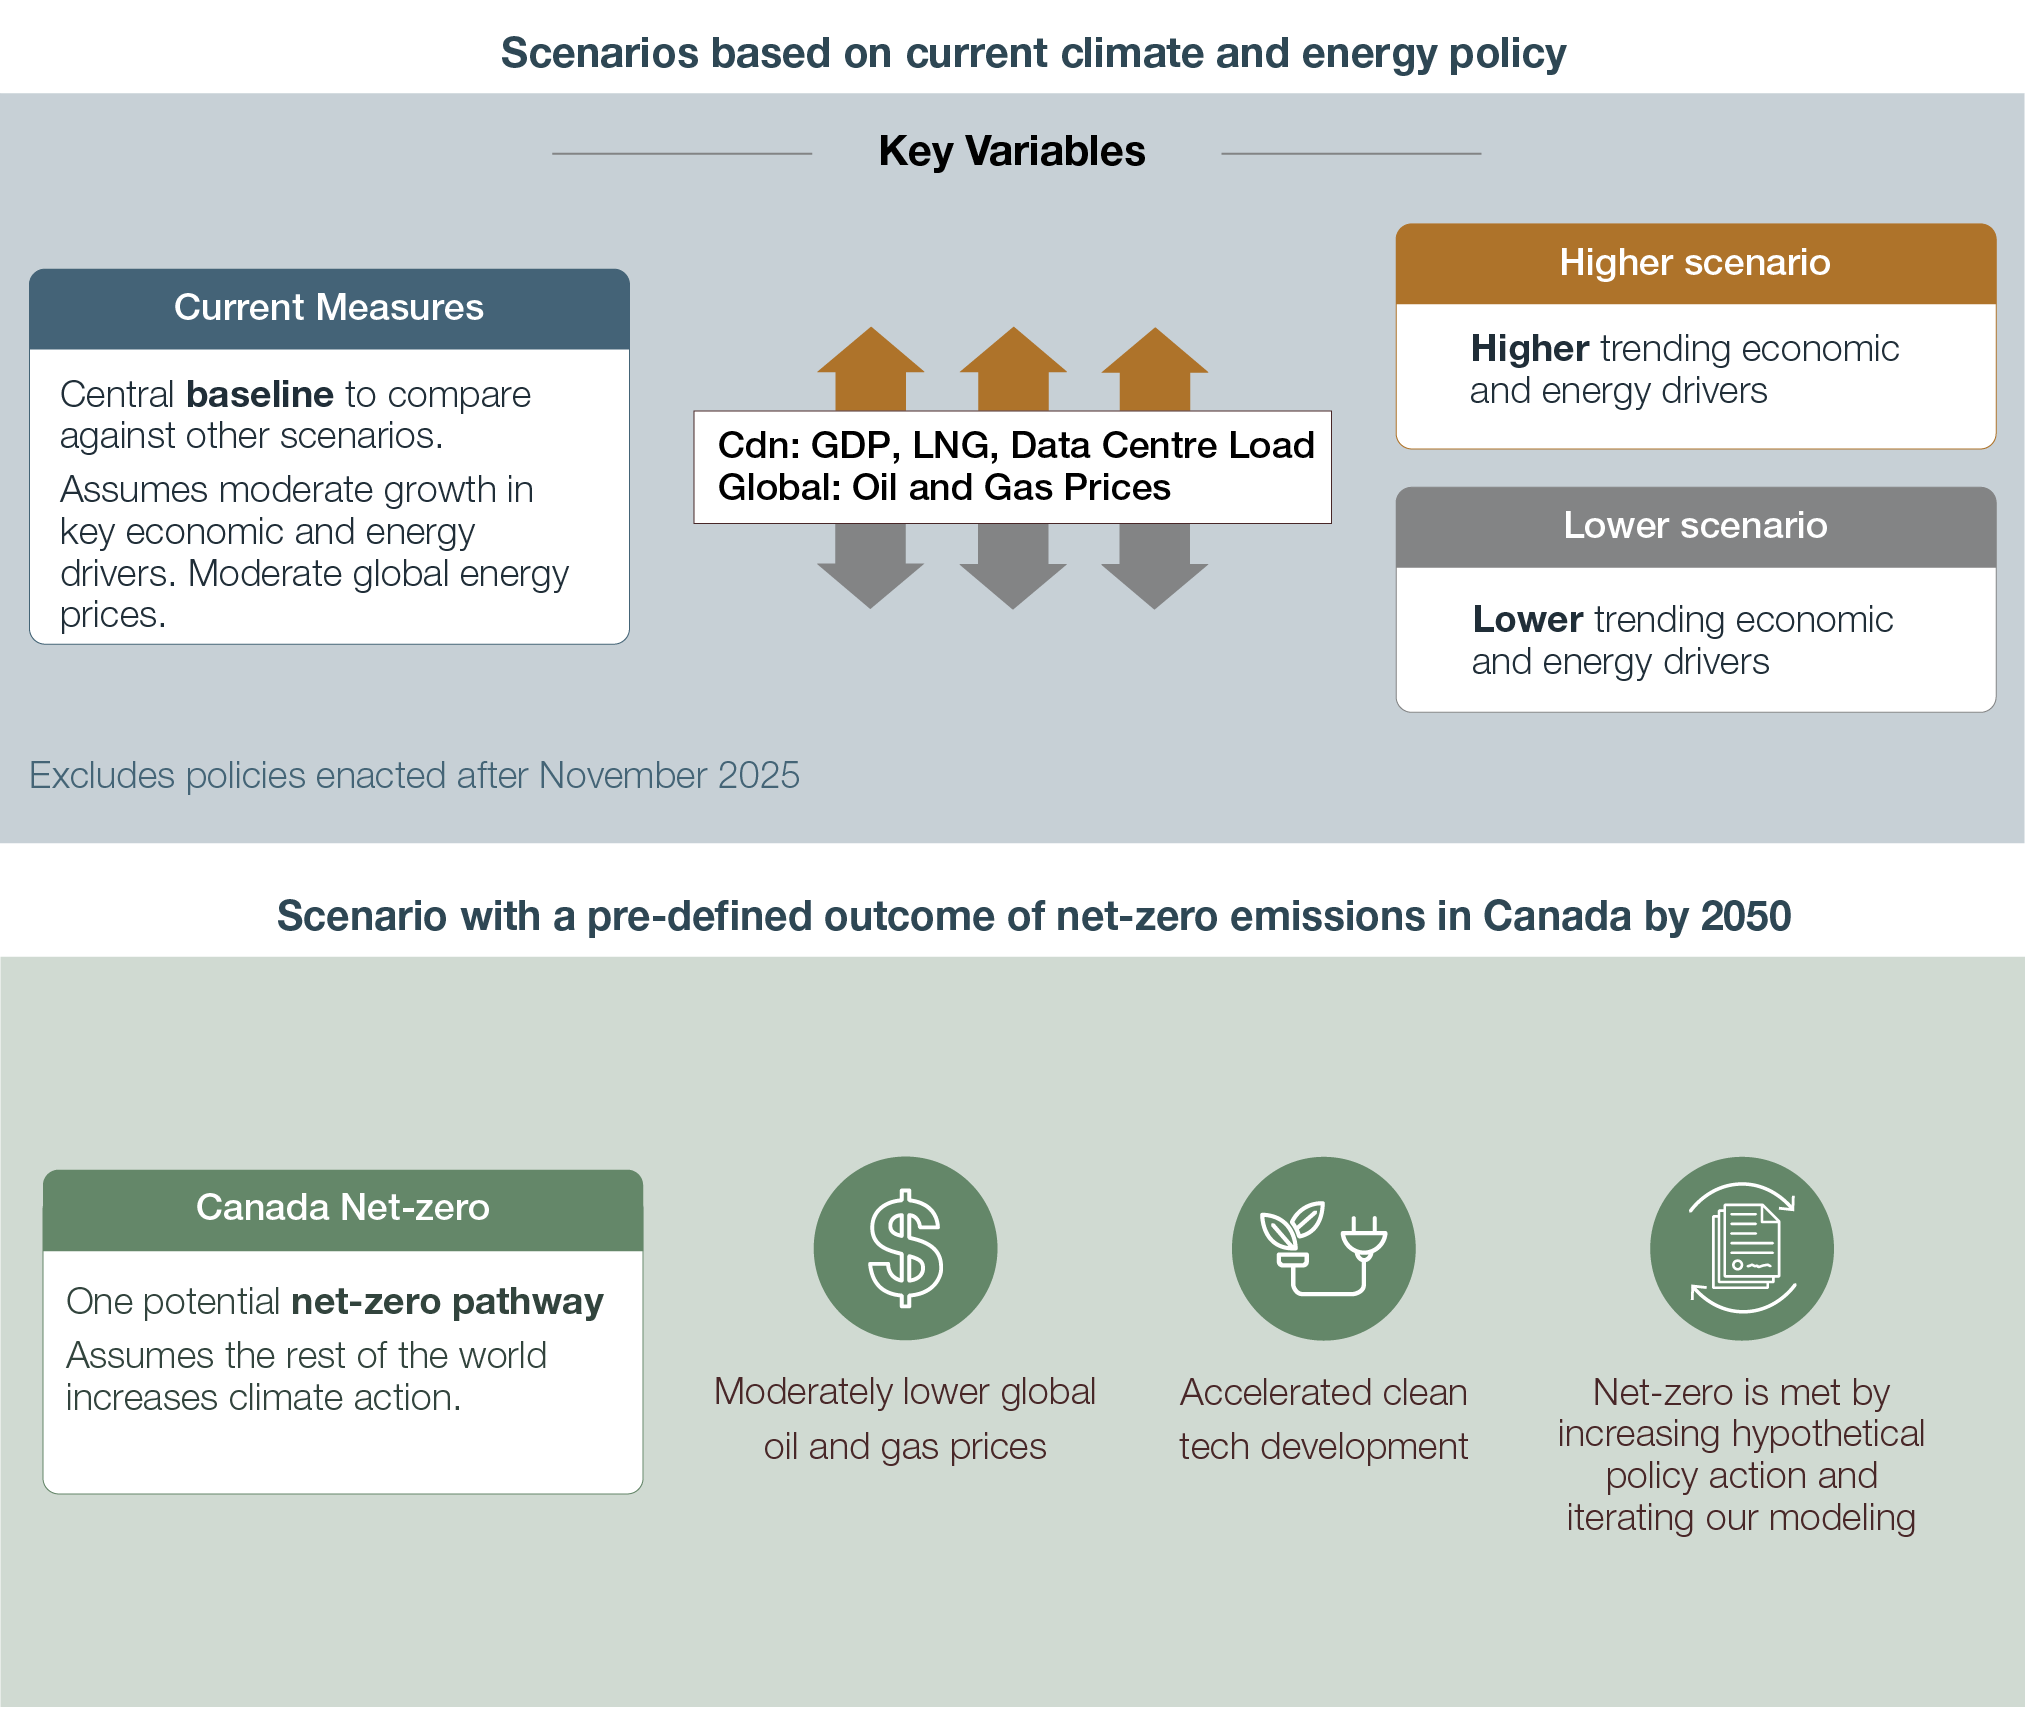
Text Alternative: This figure shows the scenarios and assumptions in this report. It briefly describes the assumptions of the scenario, including a description of the key uncertainties that are explored in the Higher scenario and Lower scenario. The figure also describes how Canada Net-zero differs from the other ones.
Domestic climate policies include laws, regulations, and programs put in place by governments with the goal of reducing GHG emissions. Such policies can affect the trajectory of Canada’s energy system. This section outlines assumptions about the climate policies modeled in each scenario in this report. Additional details are available in Appendix 1: Domestic Climate Policy Assumptions.
In Current Measures, Higher scenario, and Lower scenario, policies that are currently in place were included. A policy is “in place” if it was enacted before the end of November 2025. Due to this timing, we do not include the Enhanced Methane Regulations, published in December 2025, in Current Measures, Higher scenario, and Lower scenario.
Some key policies that have been recently enacted or changed include:
On 27 November 2025, the governments of Canada and Alberta released the Canada-Alberta Memorandum of Understanding (MoU). In it, they make a number of commitments, and outline that they will appoint an Implementation Committee that will be responsible for delivering various outcomes, including three different agreements by 1 April 2026.
Given the subject matter of the MoU, it may impact the Canadian energy outlook, including by potentially affecting certain climate policies in Alberta, such as the Clean Electricity Regulations, industrial carbon pricing, and the regulation of methane emissions. However, we have not altered our assumptions in this report to reflect the MoU, since it did not result in final and fully detailed policy changes by our policy cutoff date of the of end of November 2025. Future changes to energy and climate policies, including any stemming from the MoU, will be reflected in future editions of the Canada’s Energy Future report.
In Canada Net-zero, we begin with the end goal in mind: net-zero GHG emissions in 2050 and use our models to identify a pathway to that point. We do this by increasing the stringency of our policy assumptions in an iterative manner until our models show a net-zero pathway (Figure A.2).
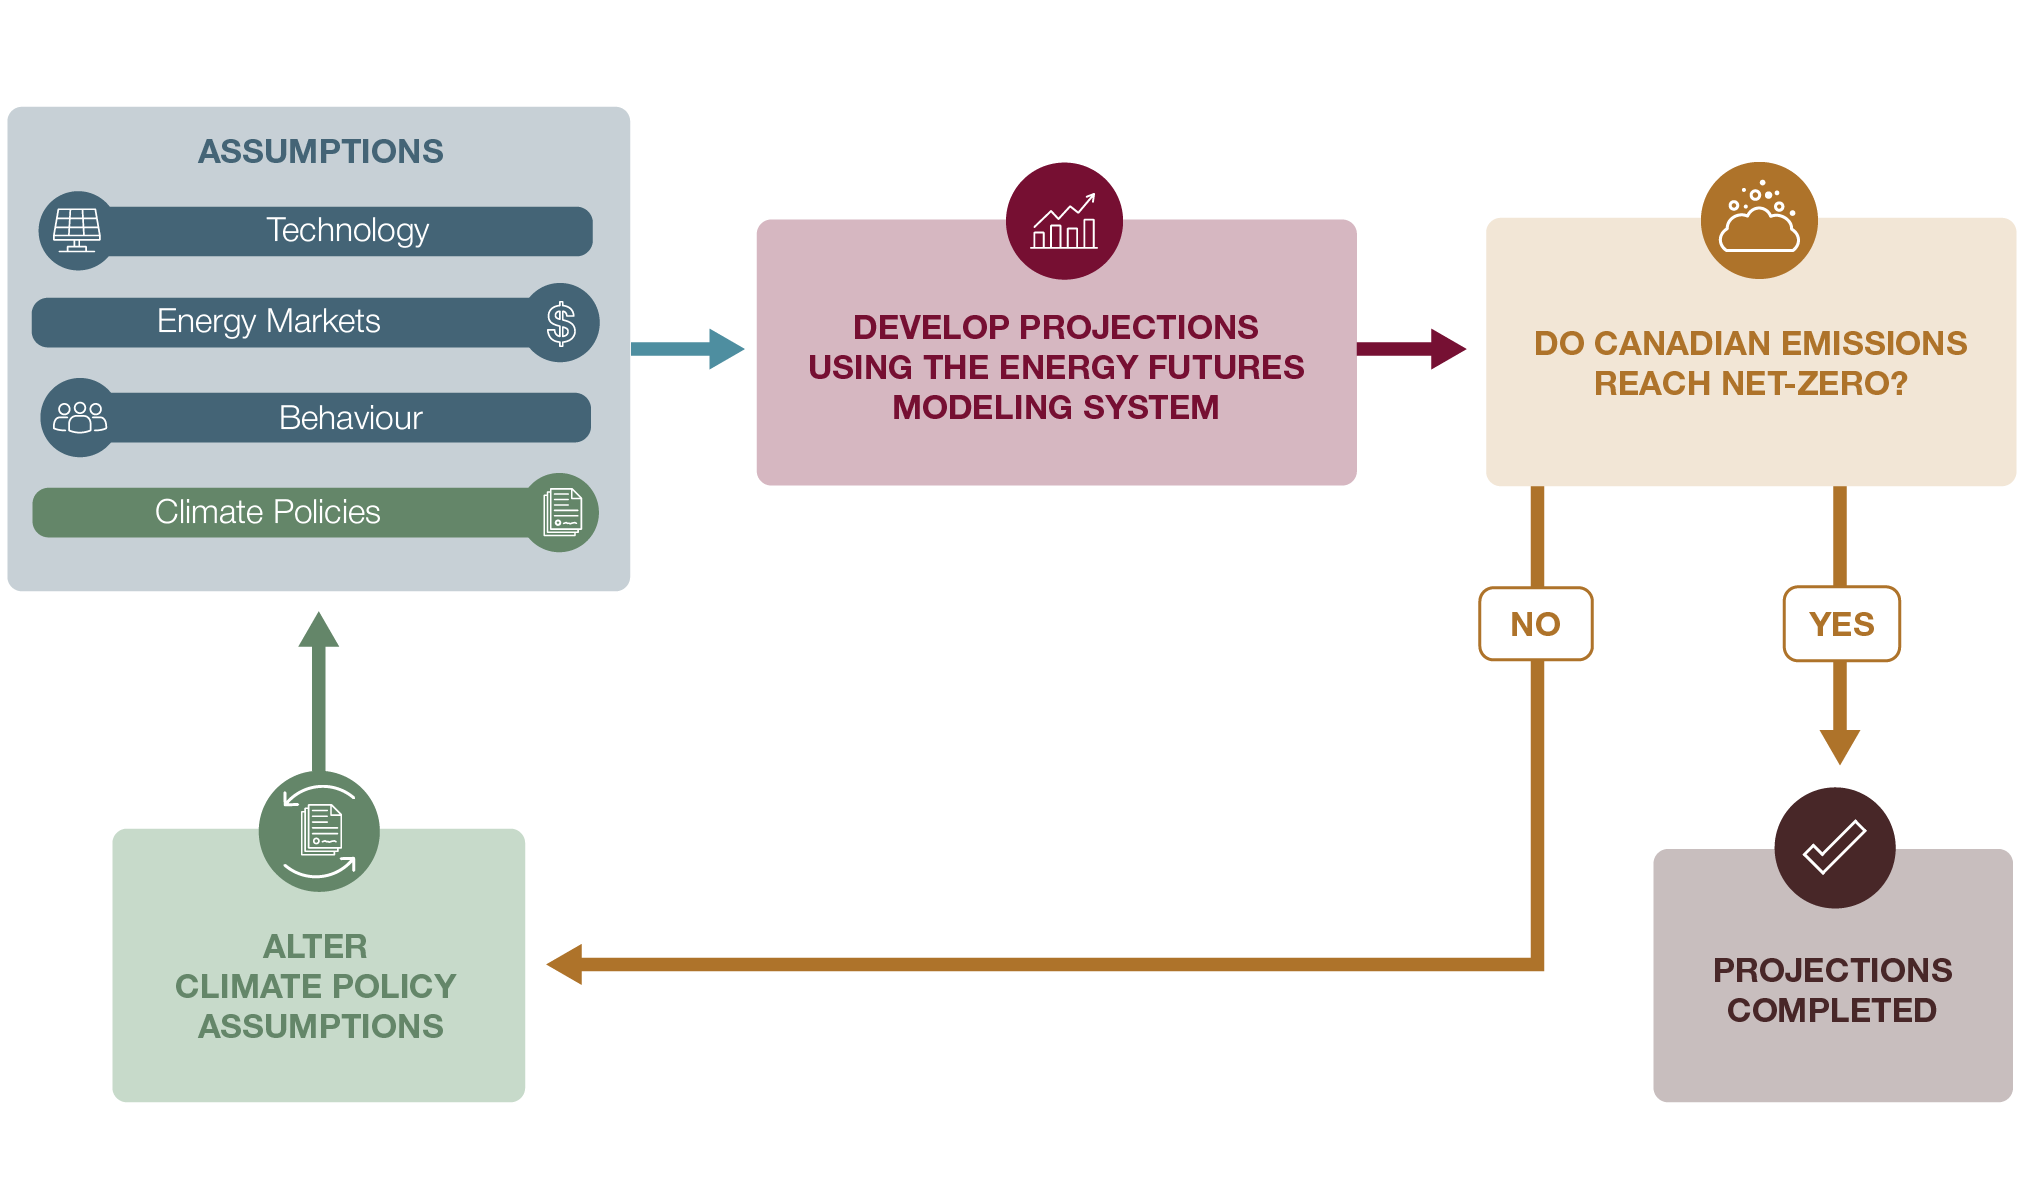
Text Alternative: This figure shows the modeling approach in the Canada Net-zero scenario. Specific assumptions about technology, energy markets, behaviour and climate policies are used to develop projections using the Canada’s Energy Future modeling system. If the output doesn’t lead to Canada reaching net-zero emissions by 2050, the climate policy assumptions are incrementally altered until the projections reach net-zero.
The specific assumptions we change to increase climate policy stringency in Canada Net-zero differs by sector. These hypothetical actions are not meant to represent likely or recommended policy. Instead, they extend the direction signaled by existing or proposed measures, such as the Clean Fuels Regulations, ZEV initiatives, and strengthened methane regulations, to illustrate a pathway consistent with achieving net-zero. Our assumptions are:

Further details on these assumptions are available in Appendix 1: Domestic Climate Policy Assumptions.
Current Measures assumptions, such as global energy prices, are based on a review of baseline scenarios from various global outlooks. The Higher and Lower scenarios include higher and lower global oil and natural gas price assumptions, to test the impacts of these important drivers of Canadian oil and natural gas production on our projections.
Our scenarios are designed to span a plausible range of market outcomes, recognizing the uncertainty surrounding growth, investment, and trade. Canada Net-zero presumes that faster global climate action leads to lower global oil and natural gas demand, thus contributing to lower assumed international oil and natural gas prices than in Current Measures. We developed the Canada Net-zero oil and natural gas price assumptions by surveying various global outlooks and scenarios that reflect a world where other countries act on their climate pledges and global emissions are reduced, but not enough to reach the aspirational target of limiting warming to 1.5°C above pre-industrial levels, and are closer to 2°C.Footnote 3
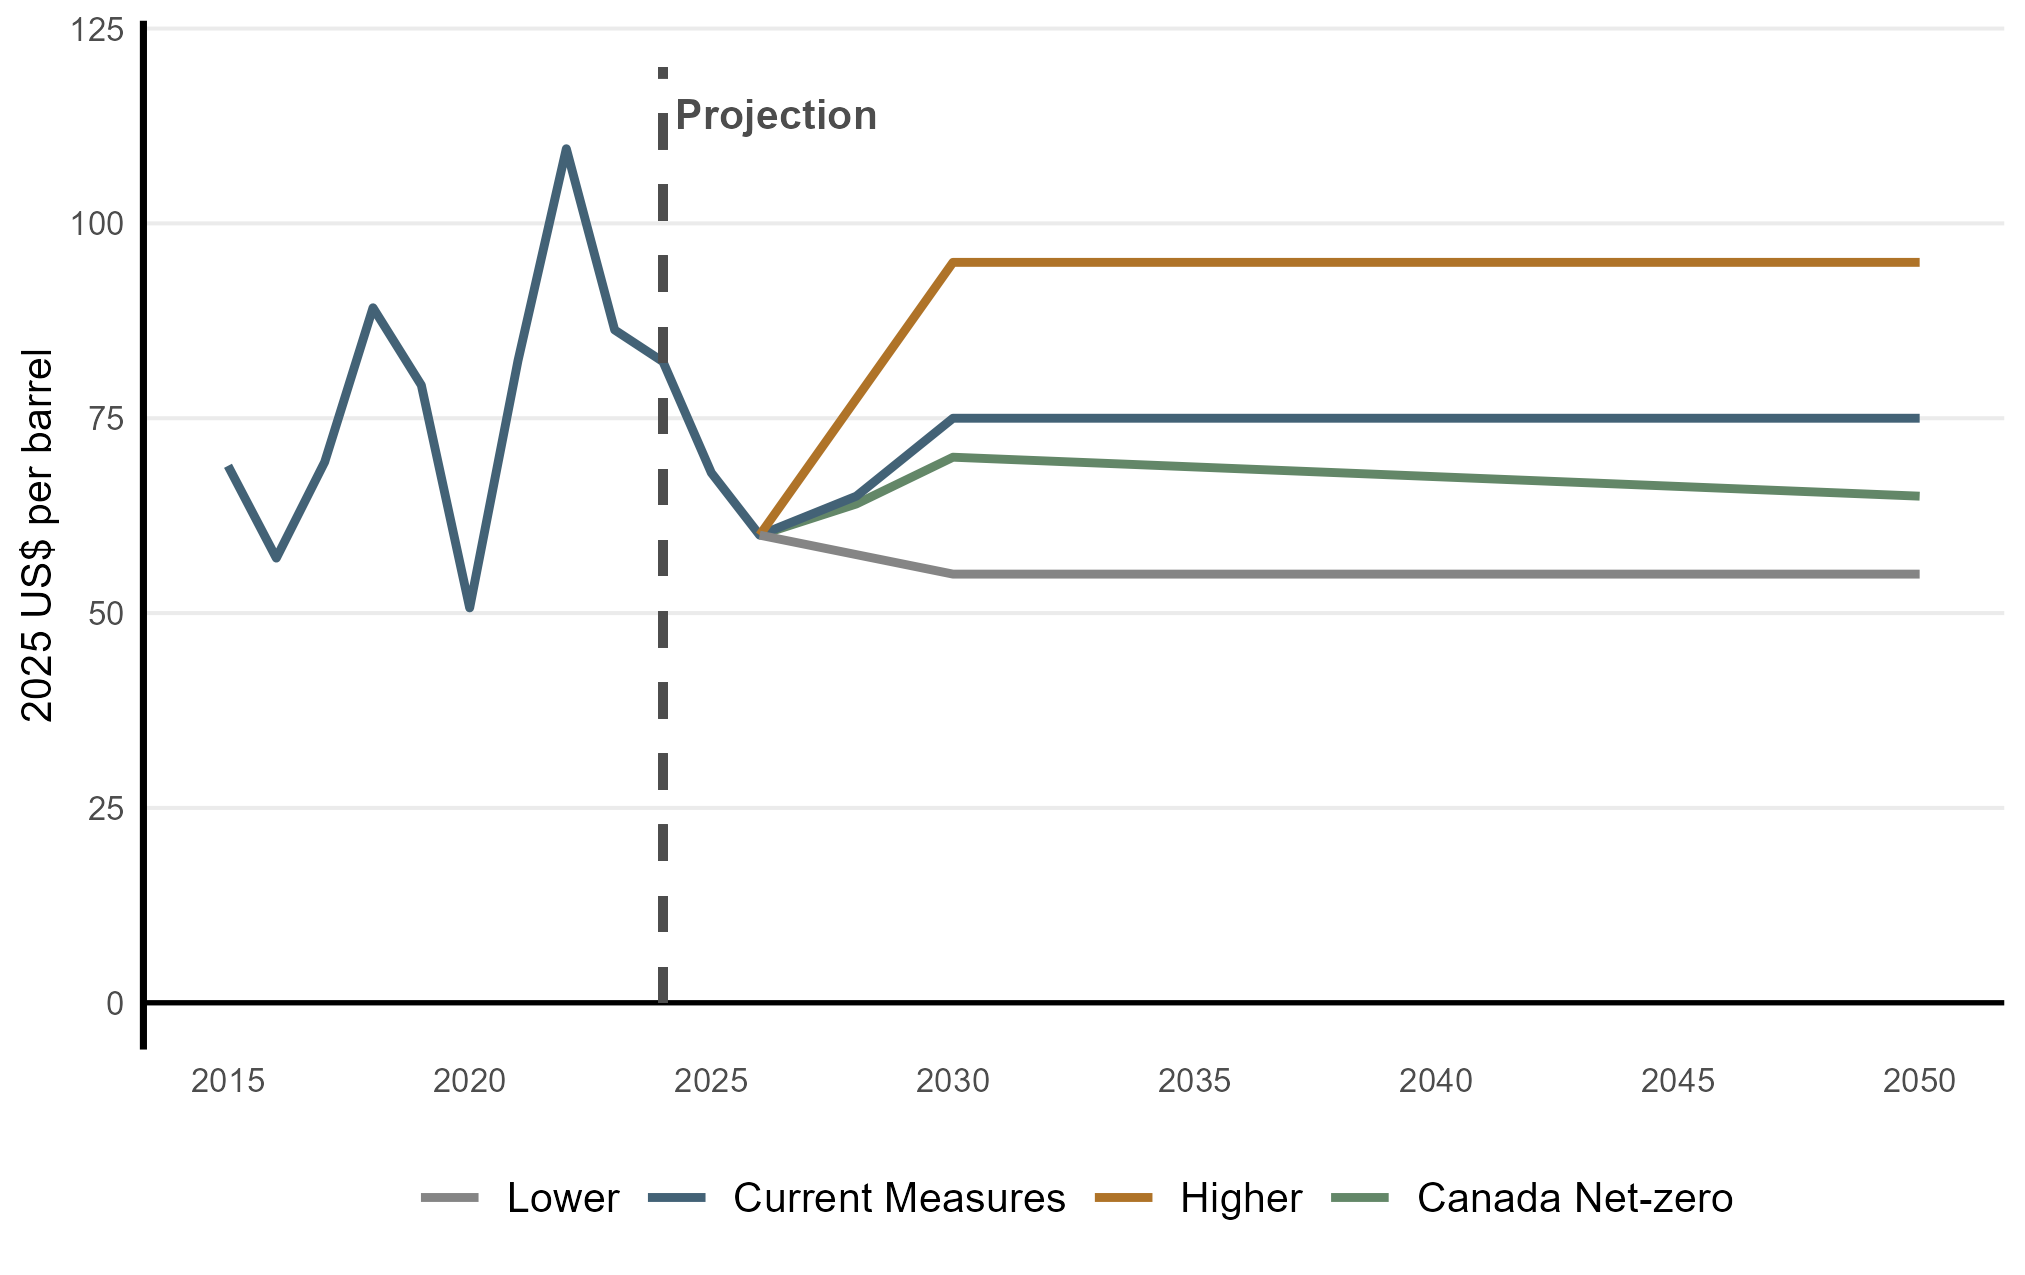
Figures A.3 and A.4 show crude oil and natural gas price assumptions, respectively.
Text Alternative:This figure shows assumed international crude oil price (Brent) across scenarios in 2025 US$ per barrel. Prices rise from recent levels to $75 per barrel by 2030 in Current Measures, whereas the Higher scenario sees prices of $95 per barrel, the Lower scenario $55 per barrel, and Canada Net-zero $70 per barrel over the same period. Prices remain constant in real terms beyond 2030, except for Canada Net-zero where it gradually falls to $65 per barrel by 2050.
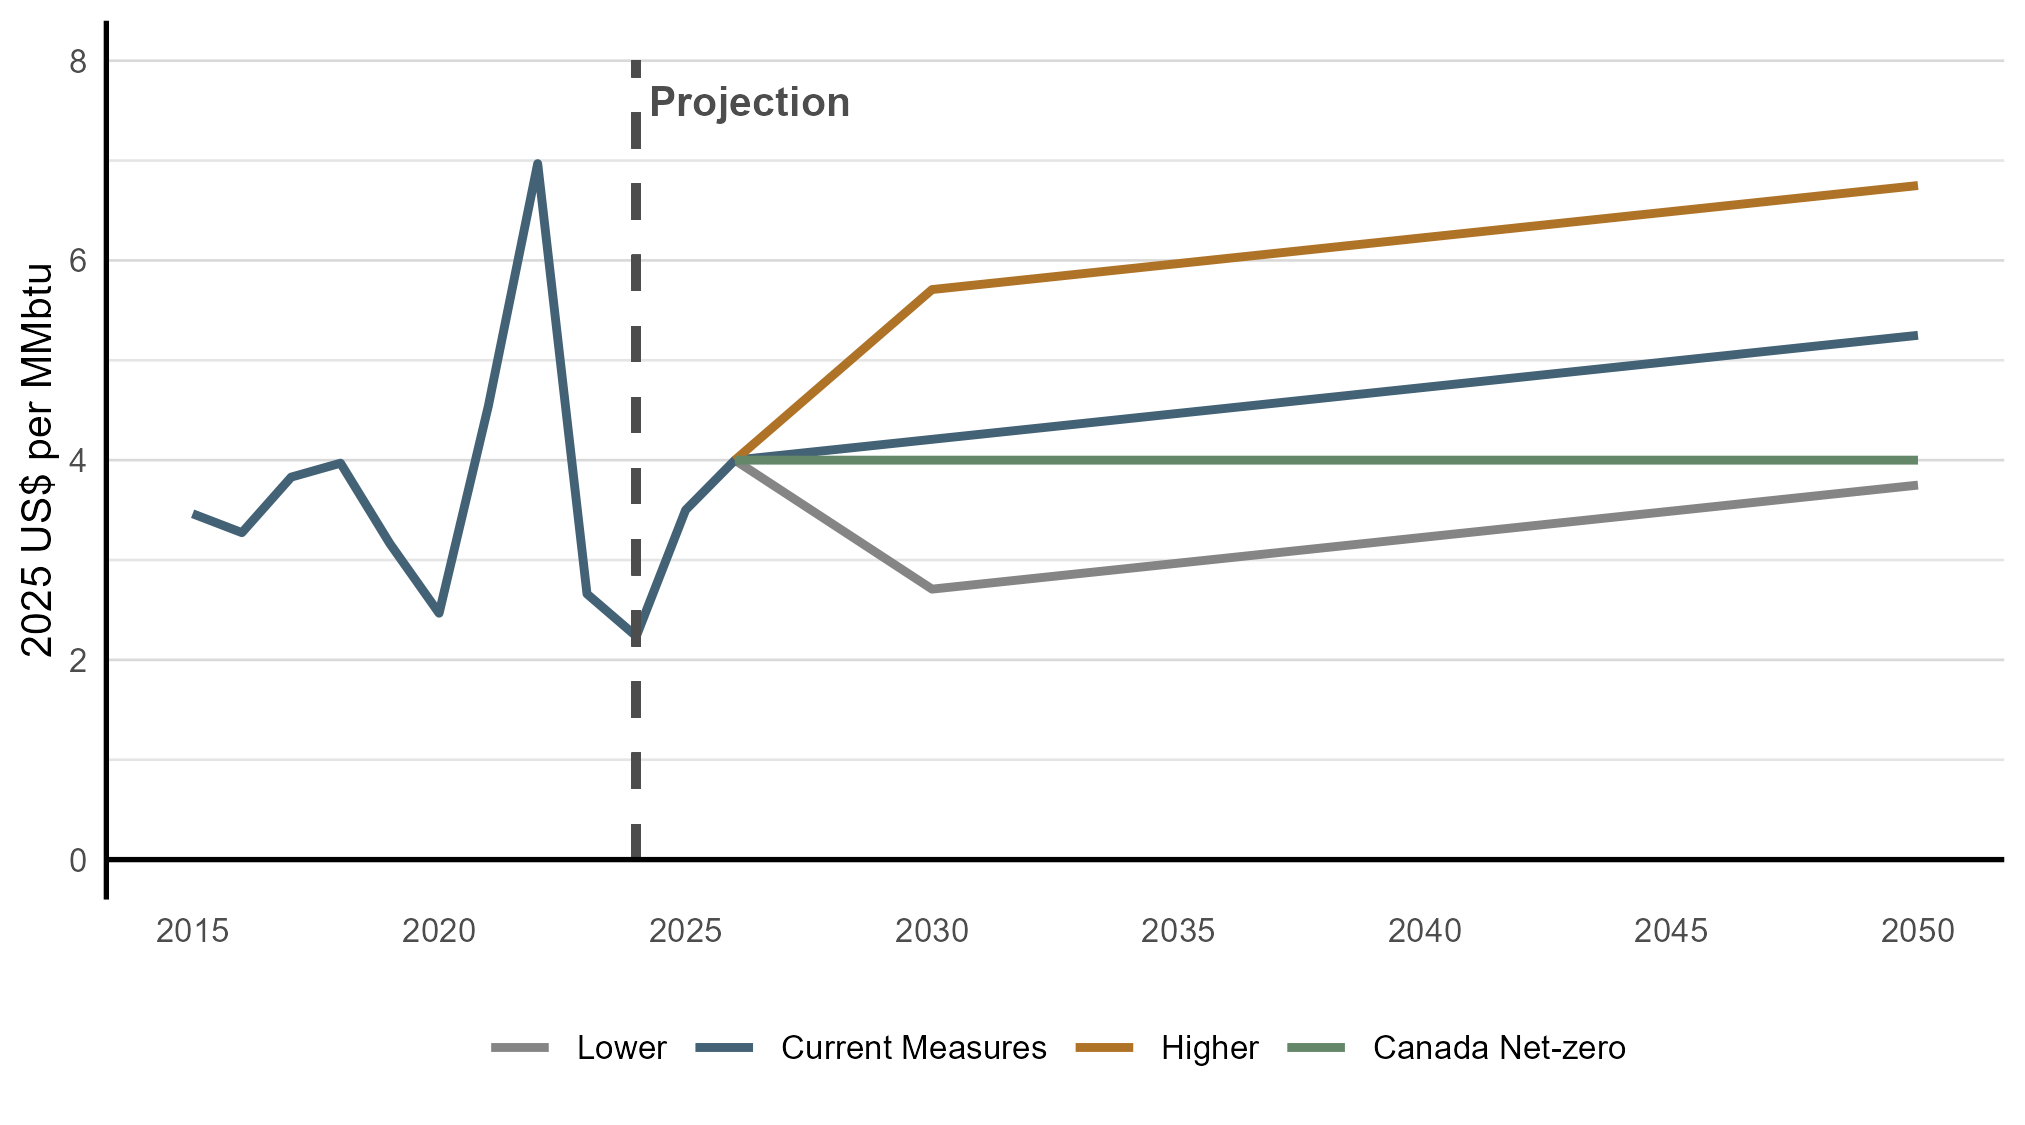
Text Alternative: This figure shows assumed international natural gas price (Henry Hub) across scenarios in 2025 US$ per MMBtu. In Current Measures, the price rises to around $5.25 per MMBtu in 2050. In the Higher scenario it rises rapidly until 2030 and then more steadily, to reach $6.75 in 2050. In the Lower scenario it goes down to around $2.75 per MMBtu by 2030 and then goes up again to almost reach 2026 levels by 2050. In Canada Net-zero, it remains flat at $4.00 per MMBtu across the projection period.
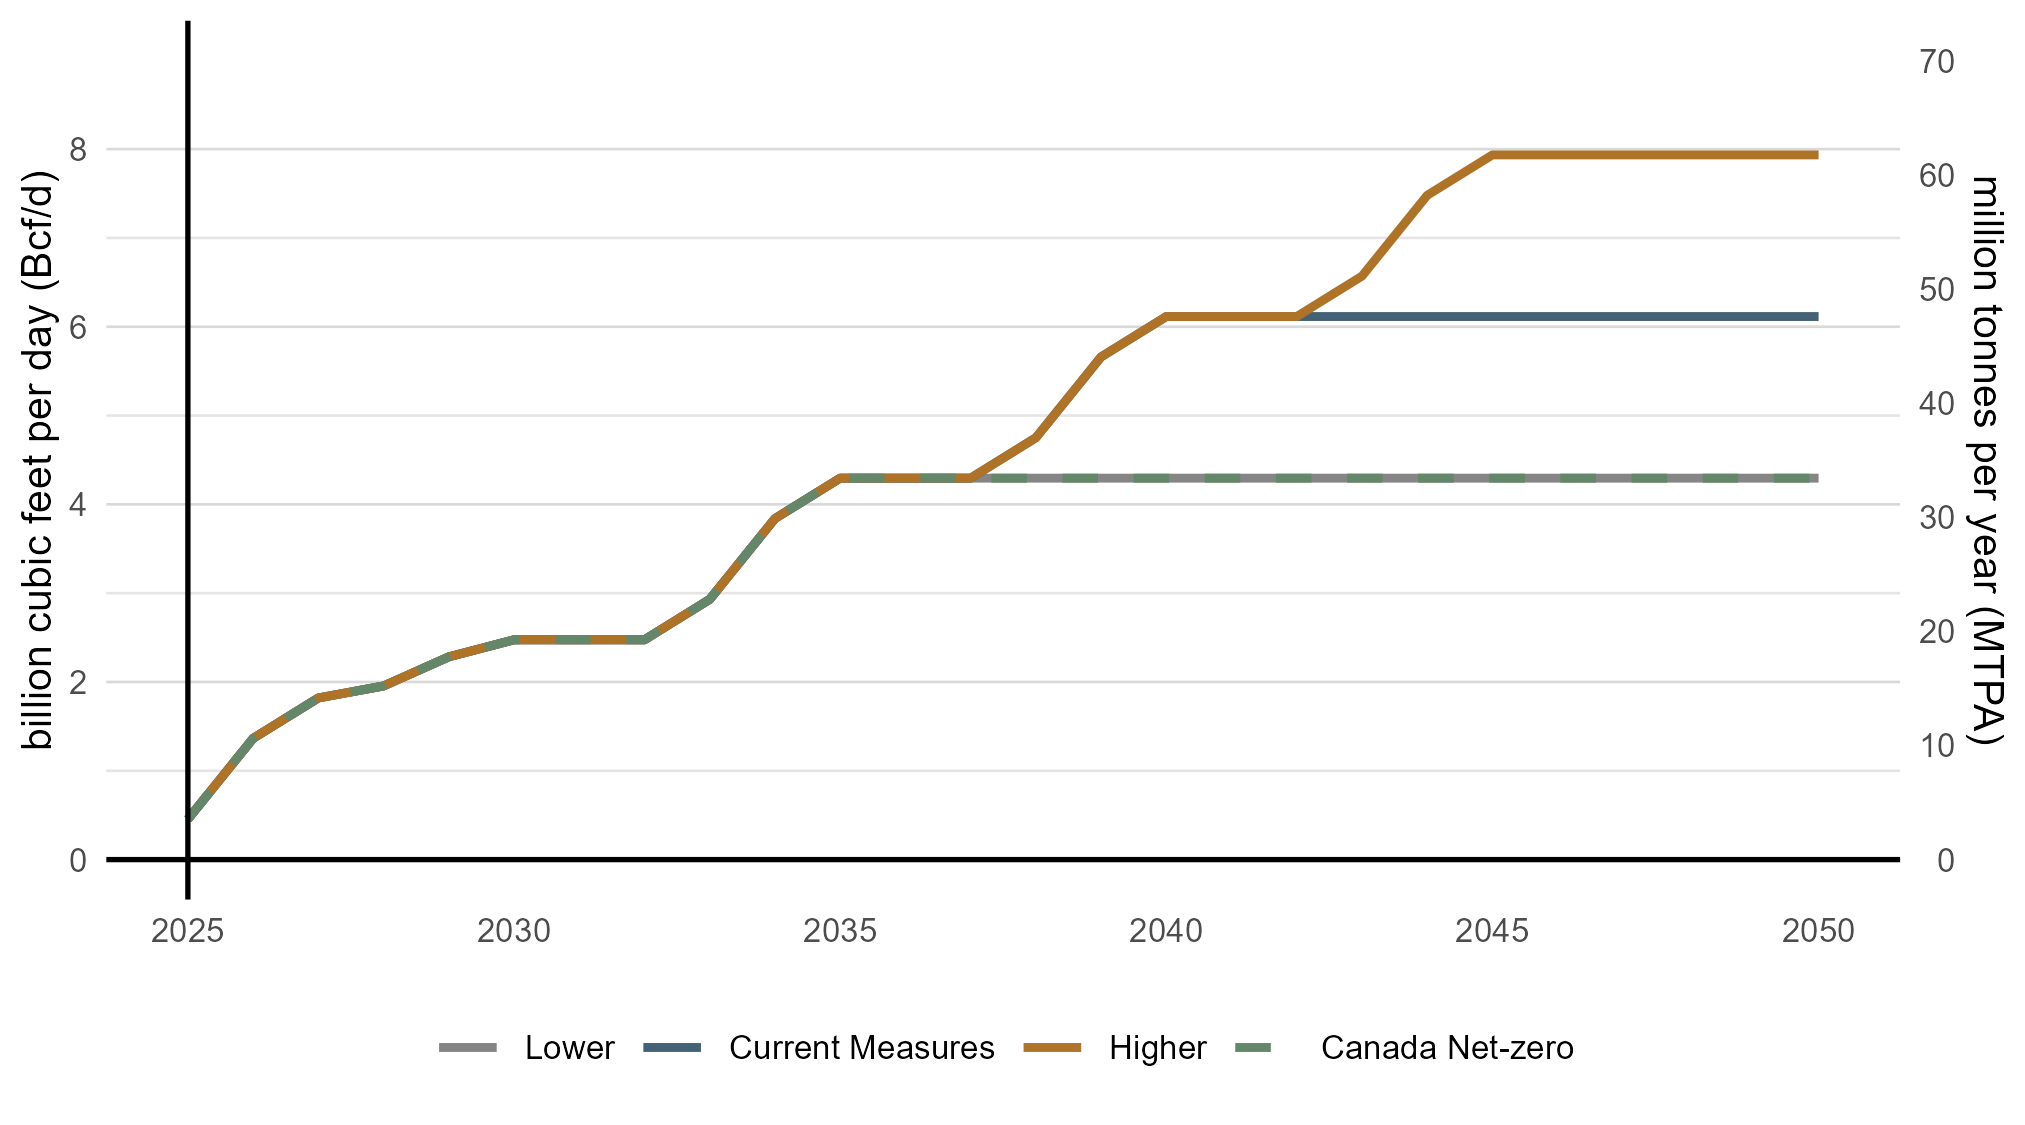
Canadian LNG export assumptions also differ by scenario, as shown in Figure A.5. Canadian LNG exports are an important assumption for natural gas production, because they are likely to lead to increased production to meet export demands. In Current Measures, we include all projects that are operational or under construction and assume two additional hypothetical large projects come online in B.C. in the future. In the Higher scenario, we assume three hypothetical projects, whereas in the Lower scenario and Canada Net-zero we assume one. We assume 75% of the natural gas that will be liquefied will come from natural gas production dedicated to supplying LNG facilities. This means that this 75% comes from production that only exists because LNG export capacity exists and is above and beyond what would be produced based solely on our North American natural gas price assumptions. Importantly, inclusion here has no bearing on any regulatory approvals, including by the Commission of the CER, nor does it suggest any particular outcome of regulatory processes.
Text Alternative: This figure shows assumed Canadian LNG export volumes across scenarios. Exports increase gradually starting in 2025 as initial projects come online. In the Lower scenario, volumes reach 4.25 Bcf/d in 2035 and remain flat for the rest of the projection period. Current Measures follows the same path and then rises to 6 Bcf/d by 2040. The Higher scenario follows the same path as Current Measures until 2035, after which there is additional growth leading to 8 Bcf/d by 2045. In Canada Net-zero levels are the same as the Lower scenario. Export volumes remain constant after reaching their peak in each scenario.
Current Measures, and the Higher and Lower scenarios assume a baseline view on technological development for clean technologies. We develop these assumptions by reviewing technology cost outlooks from various agencies, such as the U.S. National Renewable Energy Laboratory and the IEA. Costs for renewables, power storage, carbon capture, and other technologies continue to decline at varying rates, depending on their current momentum and potential for further reductions.
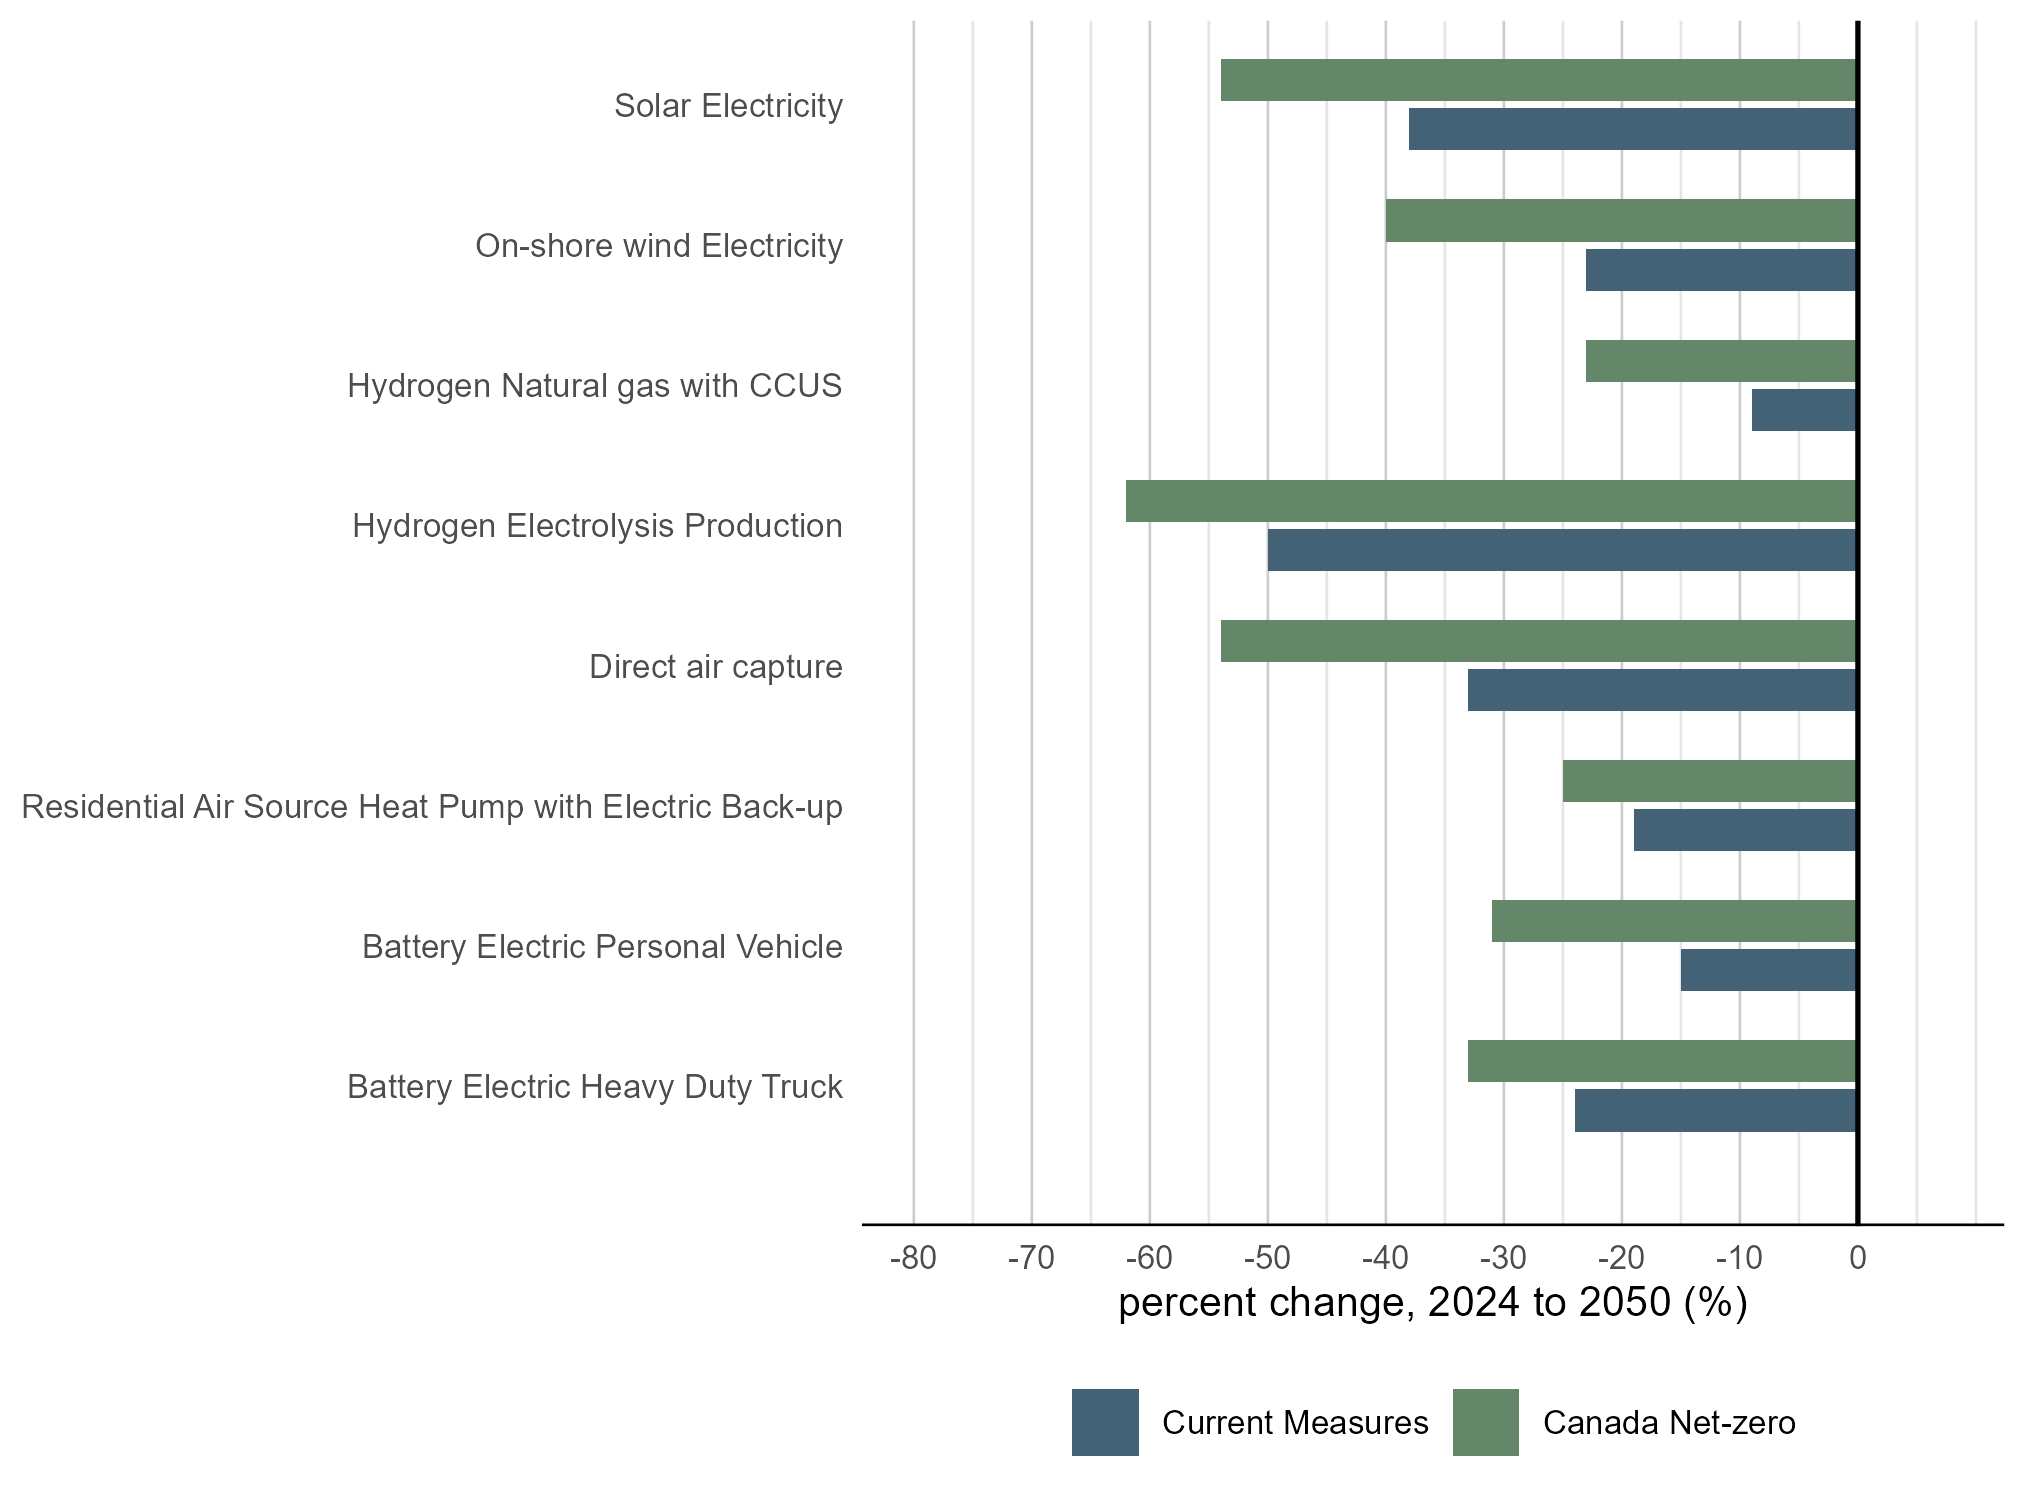
Canada Net-zero assumes faster cost declines of clean energy technologies, reflecting a global environment of stronger climate action and greater investment, leading to additional technological advances that reduce costs. Figure A.6 compares our cost reduction assumptions for key clean technologies in Current MeasuresFootnote 4 and Canada Net-zero. Across these technologies, cost reductions in Canada Net-zero range around 20-60% more than in Current Measures. Full technology details (including the actual cost values and additional technologies) are available in Appendix 2: Technology Assumptions.
Text Alternative: This figure shows the assumed percentage decline in capital costs for selected clean energy technologies between 2024 and 2050 in both the Current Measures and Canada Net-zero scenarios. Across all technologies, costs fall more steeply in the Canada Net-zero scenario, to varying degrees.
The macroeconomic outcomes contained in this report are modeled results in all four scenarios and are described in the Results chapter. They result from an iterative process where our energy system results and initial macroeconomic conditions are exchanged between the energy models and the macroeconomic model. In the Higher and Lower scenarios, we assume faster and slower economic growth, respectively. We do this by assuming demand for Canadian exports is stronger or weaker compared to Current Measures. For these scenarios, we adjusted export demand to target approximately +/- 0.4% growth in Canadian real GDP per year, compared to Current Measures. Further implications of faster or slower growth in these scenarios (such as changes to population growth, inflation, or the exchange rate) are a result of the macroeconomic modeling.

Rapidly rising electricity demand from data centres is an emerging topic of interest, in both Canada and the world. Much of this growth in electricity demand is driven by the substantial power required to train large language models (LLMs), a type of artificial intelligence (AI) application, and to supply the growing public use of these applications. Many utilities are factoring in increasing data centre load growth into their future planning outlooks. Data centres pose a challenge for outlooks because they can be large and quite uncertain, depending on the development of the emerging industry.
Given the potential impact of significant data centre growth on electricity demand, we assume additional demand in the commercial sector across all scenarios. We do so because current models cannot yet reliably estimate long-term data centre demand given how new and fast evolving the industry is. For Current Measures and Canada Net-zero, we add 1.5 GW of data centre load by 2030, and 3.5 GW by 2050. This baseline view is guided by available data from Canadian utility and system operator outlooks in their baseline outlooks, with most growth occurring in Ontario, Alberta, and Quebec. In the Lower scenario, we add 0.5 GW by 2030 and 1.5 GW by 2050. In the Higher scenario, we add 2.7 GW in 2030, and 12 GW in 2050, including additions in all provinces. The range of data centre load growth in the Higher and Lower scenarios allows us to explore this emerging uncertainty. As this industry develops, actual load growth may be higher or lower than assumed in our modeling.